 Bullish Portfolio
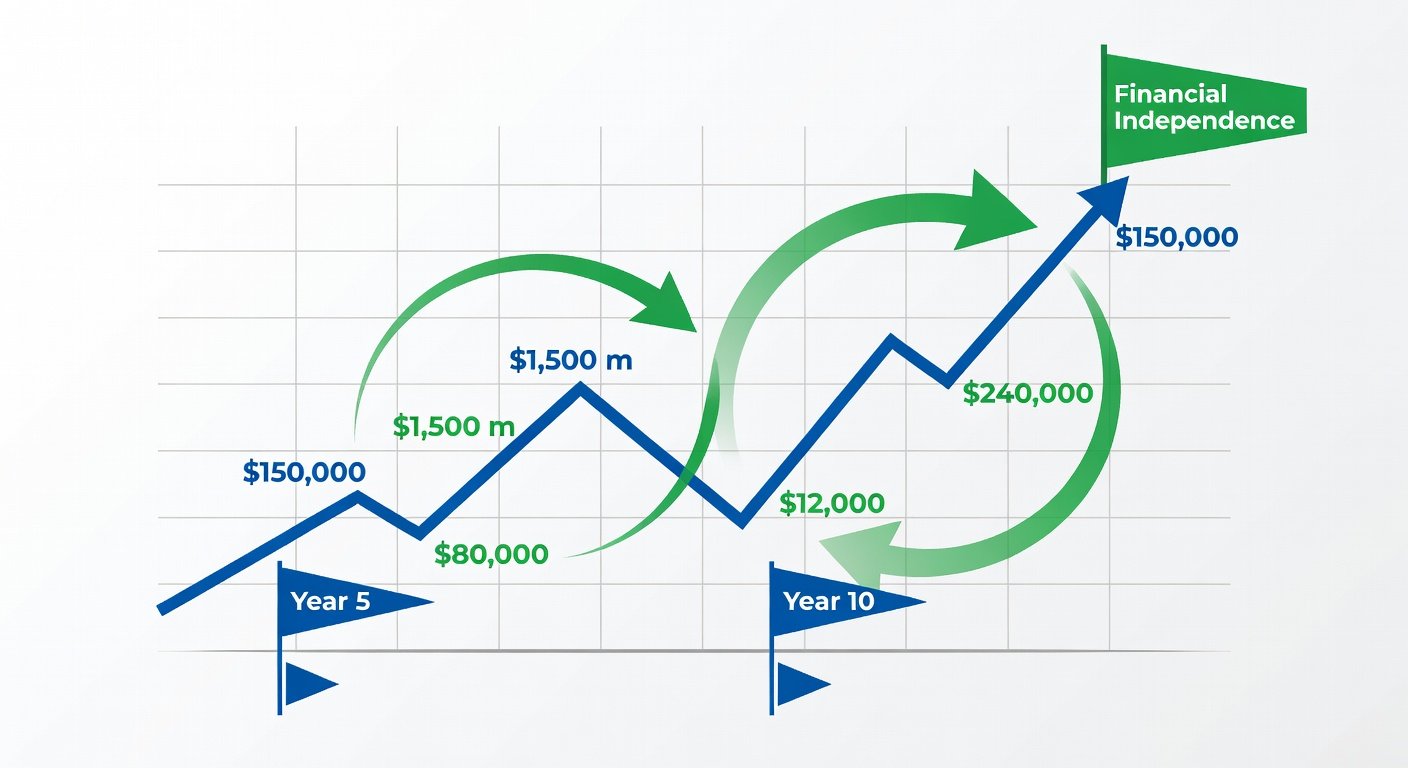
Introduction: Turning Compounding into Visible Progress
Compounding is the engine behind long-term wealth, yet many investors struggle to measure its real-world impact. This guide provides a complete framework for tracking compounding returns so you can accelerate your journey to financial independence (FI). By converting abstract percentage gains into concrete milestones, you stay motivated and make smarter adjustments along the way. Effective tracking combines reliable tools, precise metrics, and disciplined review habits. Whether you manage a modest taxable account or a large retirement portfolio, the methods below help you see exactly how each contribution and market cycle compounds over time. Investors who implement structured tracking often discover that small, consistent improvements in returns or savings rates create outsized differences after ten or twenty years. The goal is not perfection but visibility that supports better decisions.
Choosing Reliable Calculators and Dashboards
Start with tools that handle both historical performance and forward projections. Popular options include free compound-interest calculators from established financial education sites and portfolio trackers that import brokerage data automatically. Look for platforms offering customizable time horizons, inflation adjustments, and exportable reports. Trusted resources such as Investopedia provide transparent formulas you can verify yourself. For more advanced visualization, consider Morningstar’s portfolio tools or open-source spreadsheets shared by the Bogleheads community at Bogleheads. Always cross-check results across two platforms to avoid input errors. When evaluating dashboards, prioritize those that separate investment returns from contributions so you can isolate true compounding effects. Some investors prefer simple spreadsheets for full control, while others use integrated apps that sync directly with brokerage accounts. The best choice depends on your comfort with data entry and desire for automation. Test a few options during your first quarter to find what fits your workflow without overwhelming you with unnecessary features.
Essential Metrics to Track
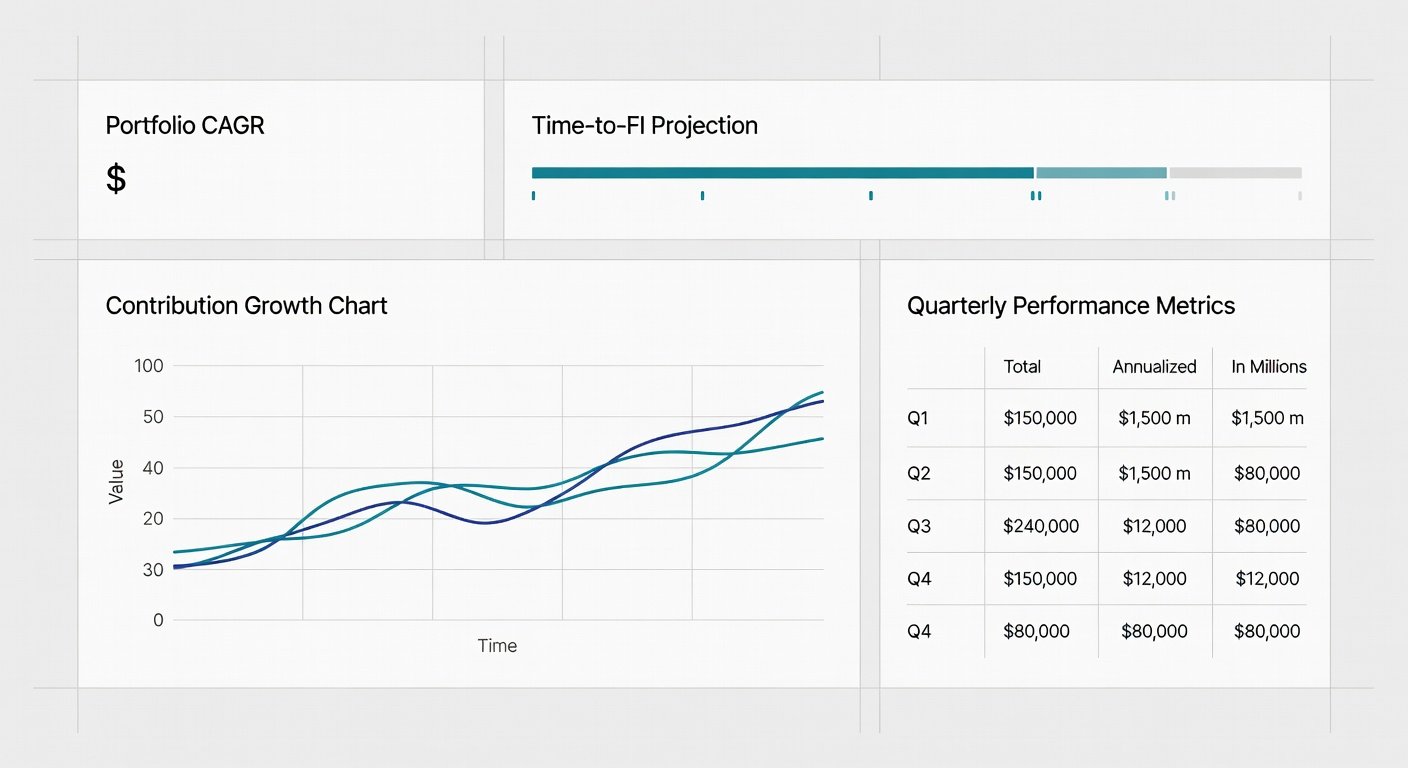
Focus on three core numbers that reveal compounding power. Effective Annual Growth Rate (CAGR) measures the smoothed annual return after fees and taxes. Time-to-FI Projection estimates years until your portfolio can sustainably support your target withdrawal rate. Contribution-Adjusted Growth isolates how much of your progress comes from market returns versus new savings. These metrics turn raw statements into actionable insights. For example, seeing CAGR rise from 7% to 9% over two years signals improving allocation or lower costs. You should also monitor your personal FI number, calculated as annual expenses multiplied by your safe withdrawal rate, typically 25x for a 4% rule. Update this figure annually as lifestyle costs change. Tracking the gap between current portfolio value and your FI target provides a powerful visual motivator during market downturns.
Real Portfolio Examples with Before-and-After Snapshots
Consider an investor starting with $150,000 at a 7.5% average annual return who adds $1,500 monthly. After 36 months the portfolio reaches approximately $240,000. The CAGR calculation shows 8.2% when contributions are factored correctly. Adjusting the same scenario to include a 0.2% fee reduction lifts the projected balance by more than $12,000 after ten years, illustrating the quiet power of cost control. Another case involves a couple targeting FI in 12 years who runs quarterly Monte-Carlo simulations. When actual returns lag the modeled 8% by 1.4%, they increase savings by 8% rather than chasing higher-risk assets. This disciplined response keeps their FI date on track. A third example features a solo investor who began with $80,000 and added irregular bonuses. By logging every contribution and recalculating CAGR each quarter, they identified that bonus windfalls invested immediately boosted long-term compounding more than spreading them out. These snapshots demonstrate that tracking is not just about numbers but about recognizing patterns that inform future actions.
Quarterly Review Steps
Follow this repeatable checklist every three months. Export brokerage statements and update your master spreadsheet or dashboard. Recalculate CAGR and compare against your personal benchmark. Review contribution consistency and note any gaps. Stress-test the time-to-FI projection using conservative return assumptions. Document one adjustment—either allocation, savings rate, or expense ratio. Consistency in this process prevents small deviations from becoming large setbacks. During each review, also examine asset allocation drift caused by market movements. Rebalancing back to target weights helps maintain your intended risk level. Many successful trackers create a simple one-page summary after each quarter that includes current portfolio value, year-to-date return, and updated FI timeline. This document becomes a valuable record for spotting long-term trends.
Adjustment Tactics When Returns Lag
When performance falls short, avoid emotional shifts. Instead, evaluate three levers in order: increase savings rate, lower fees, or modestly extend the timeline. Rebalancing toward broad-market index funds often restores compounding momentum without added risk. Keep a written log of each decision so future reviews reveal what worked. If returns lag for multiple quarters, consider whether your risk tolerance has changed or if external factors like job stability require a more conservative approach. Some investors temporarily pause new contributions to high-volatility holdings while maintaining overall savings discipline. The key is responding with data rather than fear.
Building Your Personal Tracking System
Create a dedicated folder or digital notebook for all tracking materials. Include brokerage statements, calculator outputs, and quarterly summaries. Use color-coded spreadsheets to highlight positive and negative trends at a glance. Over time this system becomes a personalized financial history that shows how compounding has worked in your specific situation. Consider adding a section for life events that impact savings, such as raises, bonuses, or unexpected expenses. Recording these events alongside performance data helps explain temporary fluctuations and keeps your projections realistic.
FAQ: Common Tracking Errors and Behavioral Pitfalls
How often should I check my numbers?
Quarterly reviews strike the best balance. Daily monitoring encourages reaction to noise rather than long-term compounding trends. Many new trackers make the mistake of checking daily and becoming discouraged by short-term volatility.
Should I include home equity in FI calculations?
Only if you plan to downsize or access equity via a reverse mortgage. Most FI trackers treat primary residences separately to avoid over-optimism about liquid assets available for withdrawals.
What if my CAGR looks lower than market averages?
Check for high fees, cash drag, or concentrated bets. Small, steady improvements in any of these areas compound powerfully over a decade. Comparing your results to broad indexes like the S&P 500 provides useful context but remember your personal goals matter most.
How do taxes affect compounding tracking?
Account for taxes on dividends, capital gains, and withdrawals in taxable accounts. Use after-tax return figures when projecting FI timelines to ensure accuracy. Tax-advantaged accounts like IRAs and 401(k)s simplify this step because growth compounds without annual tax drag.
Conclusion
Tracking compounding returns transforms vague hopes into measurable milestones. By selecting robust tools, focusing on CAGR and time-to-FI projections, and conducting disciplined quarterly reviews, you gain both clarity and control. Building a personal system that includes examples, adjustments, and behavioral awareness ensures you stay on course even when markets fluctuate. Start today with one dashboard and one simple spreadsheet—then let compounding do the heavy lifting toward financial independence.

No comments yet. Be the first!