 Bullish Portfolio

Introduction to Quantitative Portfolio Diversification in 2026
As global markets grow more interconnected and subject to rapid shifts driven by geopolitical events, technological disruption, and macroeconomic surprises, traditional portfolio construction methods increasingly fall short. Investors and institutions are embracing quantitative approaches to achieve superior diversification and precise asset allocation. These methods harness large datasets, sophisticated algorithms, and predictive analytics to build resilient portfolios. In 2026, the focus centers on optimization algorithms that solve complex allocation problems, machine learning models capable of forecasting time-varying correlations, and risk factor decomposition techniques that isolate underlying exposures. This comprehensive guide explores each element in depth, offering actionable implementation steps, institutional case studies, side-by-side comparisons with conventional strategies, and proven tactics for avoiding model overfitting through disciplined backtesting. By the end, readers will understand how to integrate these tools effectively while recognizing both their power and limitations.
Core Quantitative Techniques for Enhanced Diversification
Quantitative diversification rests on mathematical and statistical foundations rather than intuition or historical rules of thumb. Mean-variance optimization, originally developed by Harry Markowitz, remains foundational but has evolved to include multi-period horizons, tail-risk constraints, and regime-switching parameters. Modern implementations add layers such as cardinality constraints that limit the number of holdings for operational simplicity. Machine learning extends these capabilities by detecting non-linear relationships and regime changes that static covariance matrices miss. Risk factor decomposition further refines allocation by mapping assets to latent drivers including equity beta, interest-rate duration, inflation sensitivity, and liquidity premia. Together these techniques enable portfolios to maintain diversification even when asset-class correlations spike during crises.
Optimization Algorithms in Practice
Effective portfolio optimization requires algorithms that handle real-world frictions. Quadratic programming efficiently solves classic mean-variance problems but struggles with integer constraints or non-convex objectives; therefore practitioners increasingly employ genetic algorithms, simulated annealing, or convex relaxation methods. The Black-Litterman framework remains popular because it produces stable weights by blending equilibrium returns with investor views. In practice, teams begin by sourcing clean, survivorship-bias-free data from multiple vendors, then define an objective function that penalizes excessive concentration and incorporates transaction-cost estimates. Regular re-optimization occurs monthly, with daily monitoring for drift. Institutional teams often layer in scenario-based stress testing to ensure allocations remain robust under adverse conditions such as sudden rate hikes or supply-chain shocks.
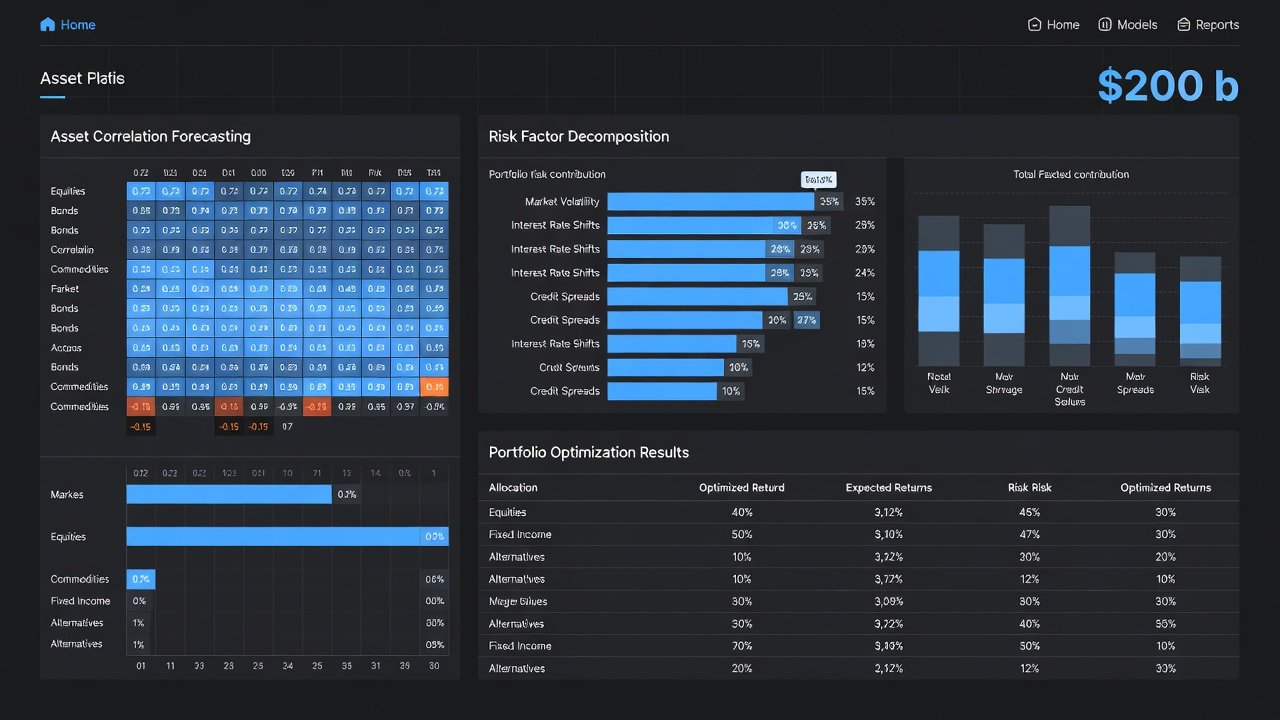
Machine Learning Models for Correlation Forecasting
Static correlation assumptions break down when markets transition between regimes. Machine learning addresses this limitation through architectures such as long short-term memory networks, temporal convolutional networks, and gradient-boosted trees that ingest both price histories and alternative signals including news sentiment, satellite imagery, and credit-card transaction aggregates. Ensemble techniques that combine multiple models reduce variance and improve out-of-sample accuracy. In 2026, leading asset managers feed these forecasts into dynamic covariance matrices that update daily, allowing tactical tilts toward assets whose correlations are expected to decline. The result is measurable improvement in risk-adjusted returns compared with rolling-window historical estimates.
Risk Factor Decomposition and Allocation
Risk factor models decompose portfolio volatility into orthogonal components rather than asset-class buckets. Principal component analysis extracts the dominant statistical factors, while hierarchical risk parity allocates capital according to factor-cluster volatility. This approach mitigates the concentration risk that arises when seemingly diversified holdings load heavily on the same underlying driver. Pension funds and endowments apply these methods to multi-asset mandates, often achieving higher Sharpe ratios and lower maximum drawdowns. The technique also supports granular hedging: once a factor exposure is quantified, targeted derivatives can neutralize it without liquidating core positions.
Practical Steps for Implementing Quantitative Approaches
- Aggregate high-quality, multi-asset datasets covering equities, fixed income, commodities, currencies, and alternatives spanning at least ten to fifteen years, ensuring adjustments for corporate actions and dividends.
- Implement walk-forward optimization and purged cross-validation to eliminate lookahead bias and account for regime shifts.
- Embed realistic transaction-cost models, bid-ask spreads, and market-impact functions directly into the optimization objective.
- Conduct extensive stress testing against historical crises such as 2008 and 2020 plus forward-looking hypothetical scenarios generated by large language models.
- Deploy automated monitoring dashboards that flag model drift, correlation breakdown, or liquidity deterioration in real time.
- Establish governance protocols requiring periodic model review by independent quantitative committees.
Real-World Examples from Institutional Portfolios
Several prominent institutions illustrate successful adoption. A major U.S. public pension plan integrated hierarchical risk parity across its $200 billion portfolio, reallocating from traditional asset-class buckets to factor exposures and reporting improved diversification metrics. Sovereign wealth funds in Asia have deployed machine-learning correlation forecasts to manage cross-border equity and private-market allocations, reducing drawdowns during regional volatility spikes. University endowments increasingly combine Black-Litterman optimization with alternative-data signals to maintain target spending rates while controlling risk. These examples demonstrate that quantitative methods scale effectively from mid-sized mandates to multi-trillion-dollar portfolios when supported by robust data infrastructure.
Comparisons to Traditional Diversification Methods
Classic 60/40 equity-bond portfolios rely on long-term average correlations and periodic rebalancing. While transparent and inexpensive, they suffer from rising correlations precisely when diversification is most needed. Quantitative frameworks continuously update weights and incorporate forward-looking signals, delivering superior performance during regime changes. Nevertheless, traditional approaches retain advantages in simplicity, lower governance burden, and easier communication to stakeholders. Many sophisticated investors therefore adopt hybrid models that overlay quantitative signals on a core traditional allocation, striking a balance between adaptability and operational ease. Federal Reserve research highlights how factor-based strategies have historically provided incremental diversification benefits during monetary-policy shifts.
Potential Pitfalls and Mitigation Strategies
Model overfitting remains the most common failure mode; algorithms that memorize historical noise produce excellent in-sample results yet collapse live. Mitigation begins with strict separation of training, validation, and test periods, followed by regularization, dropout layers in neural networks, and ensemble averaging. Data snooping is curtailed by pre-registering hypotheses before any testing occurs. Transaction costs and liquidity constraints must be modeled explicitly rather than added post hoc. Finally, continuous live monitoring with predefined kill switches prevents prolonged exposure to degraded models. SEC guidance on algorithmic trading underscores the importance of ongoing validation and risk-management controls for quantitative strategies.
Tools and Technologies Supporting Implementation
Modern quantitative teams rely on open-source libraries such as Python’s scikit-learn, TensorFlow, and CVXPY alongside commercial platforms that provide scalable backtesting engines and real-time data pipelines. Cloud computing resources enable rapid experimentation with large alternative datasets while maintaining audit trails required by regulators. Visualization tools convert complex factor decompositions into intuitive dashboards that facilitate communication between quantitative specialists and investment committees.
Conclusion
Quantitative approaches to 2026 portfolio diversification equip investors with precise, adaptive tools that traditional methods cannot match. Mastery of optimization algorithms, machine-learning correlation forecasts, and risk-factor decomposition, combined with disciplined implementation and overfitting safeguards, produces portfolios that weather market turbulence more effectively. Institutions that invest in robust data, governance, and continuous validation are best positioned to capture these advantages while managing model risk prudently.
FAQ
What data sources work best for quantitative correlation forecasting?
High-frequency price series, macroeconomic releases, credit-card aggregates, satellite imagery, and natural-language processing of financial news provide the richest inputs for modern machine-learning models.
How often should quantitative portfolios be rebalanced?
Most institutional implementations target monthly or quarterly rebalancing, supplemented by volatility-triggered or drift-based adjustments that respond faster to market events without excessive turnover.
Can individual investors access these quantitative tools?
Yes. Retail platforms now offer algorithmic optimizers, factor ETFs, and API-driven backtesting environments, although institutional-grade infrastructure still requires specialized vendors or advisory partnerships.
What is the primary benefit over traditional diversification?
Quantitative methods dynamically adjust to changing correlations and factor loadings, delivering more consistent risk control during market stress than static 60/40 allocations.
How do teams guard against regulatory scrutiny of quantitative models?
Documented model governance, independent validation committees, and transparent audit trails satisfy increasing regulatory expectations around algorithmic decision-making in asset management.

No comments yet. Be the first!