 Bullish Portfolio
Correlation-Based Asset Allocation for 2026 Diversification
Investors seeking resilient portfolios in 2026 must move beyond simple asset spreading. Correlation-based asset allocation uses statistical relationships between asset classes to minimize risk while maintaining returns. This approach identifies assets that do not move in lockstep, creating true diversification that traditional methods often miss. In an era of shifting interest rates, geopolitical tensions, and evolving economic indicators, understanding these relationships becomes essential for long-term success. By focusing on correlation data, investors can construct portfolios that deliver smoother returns across market cycles rather than relying on broad assumptions about asset behavior.
What Is Correlation in Asset Allocation?
Correlation measures how two assets perform relative to each other. A coefficient of +1 indicates perfect positive movement, while -1 signals perfect negative movement. Values near zero represent low or no relationship, ideal for diversification. Understanding these dynamics helps investors construct portfolios that weather market volatility more effectively. Correlation is not static; it can change based on macroeconomic conditions, making ongoing analysis critical. For instance, assets that appear uncorrelated in calm markets may suddenly align during crises, underscoring the need for dynamic monitoring rather than one-time calculations.
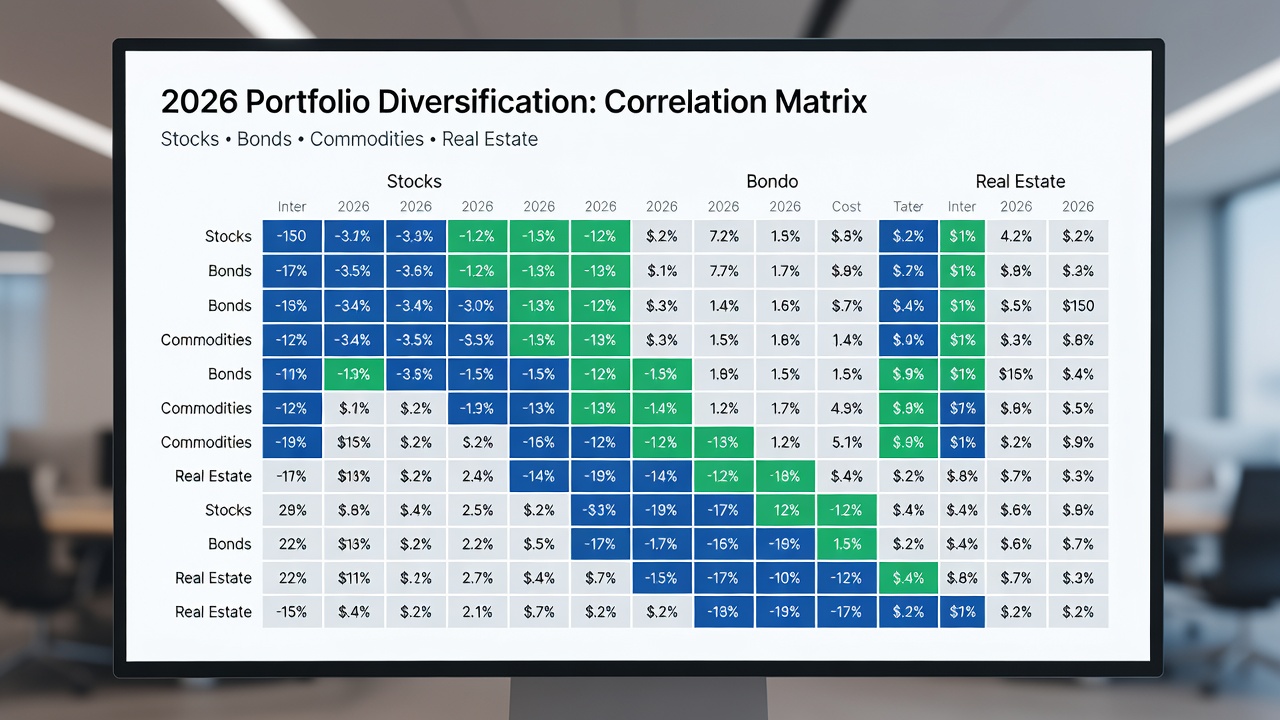
Fundamentals of Correlation Coefficients
Correlation coefficients range from -1.0 to +1.0. Positive correlations above 0.7 suggest strong co-movement, increasing portfolio risk during downturns. Negative correlations below -0.3 provide hedging benefits. Zero or near-zero correlations deliver the strongest diversification. Historical data shows that equities and bonds often exhibit low or negative correlations, making them foundational building blocks. Investors should distinguish between Pearson correlation, which assumes linear relationships, and Spearman rank correlation for non-linear data. Both methods offer insights, but combining them with rolling window analysis reveals how relationships evolve over time, allowing for more informed allocation decisions in 2026.
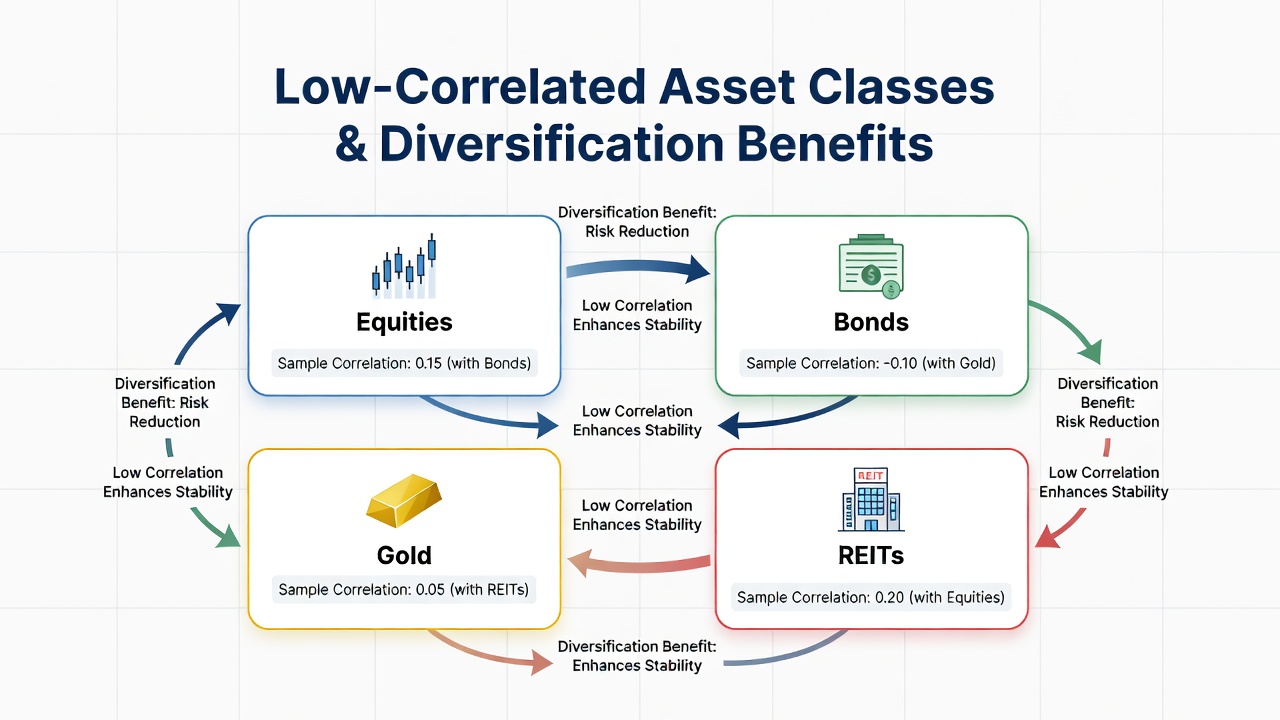
Identifying Low-Correlated Assets
Key asset classes with historically low correlations include global equities versus investment-grade bonds, commodities such as gold and oil relative to stocks, real estate investment trusts (REITs) compared with broad equity indices, alternative investments like private equity or hedge fund strategies, and international developed markets versus emerging markets. Additional candidates include inflation-linked securities and certain currency pairs that move independently of equity markets. Regularly reviewing correlation matrices helps investors spot shifting relationships caused by economic cycles or geopolitical events. For example, energy commodities may show low correlation with technology stocks during periods of stable oil prices but diverge sharply when supply disruptions occur, offering timely diversification opportunities.
Practical Steps for Implementing Correlation Analysis
- Collect at least five years of daily or weekly return data for target assets from reliable sources to ensure statistical robustness.
- Calculate pairwise correlations using spreadsheet tools or portfolio software, applying both Pearson and Spearman methods for comprehensive views.
- Visualize results in a matrix to identify clusters of high and low correlation, highlighting potential concentration risks.
- Rebalance allocations to favor assets with correlations below 0.4, adjusting weights based on risk contribution rather than equal weighting.
- Stress-test the portfolio against historical crises such as 2008 or 2020 to validate resilience under extreme scenarios.
- Monitor correlations quarterly and adjust as market regimes change, incorporating forward-looking economic forecasts.
- Document assumptions and review thresholds annually to maintain consistency in the decision-making process.
Real-World Examples from Recent Market Data
During the 2022 market decline, equities and long-duration bonds showed temporary positive correlation spikes above 0.6, challenging traditional 60/40 strategies. By early 2025, correlations between U.S. large-cap stocks and gold returned to near-zero levels, restoring diversification benefits. Portfolios that overweighted low-correlated commodities outperformed traditional 60/40 allocations by maintaining stability when equity markets corrected. Another example involves emerging market debt and developed market equities, which displayed correlations around 0.3 during 2023-2024, providing ballast during U.S. rate hike cycles. Investors who incorporated international small-cap equities alongside domestic large-caps benefited from correlations dipping below 0.5 amid regional economic divergences, demonstrating how targeted analysis can uncover hidden diversification layers.
Comparing with Traditional Diversification Methods
Traditional diversification relies on broad asset classes without examining statistical relationships. Correlation-based methods add precision by quantifying risk contributions. While both approaches aim to reduce volatility, correlation analysis prevents over-concentration in assets that appear different but behave similarly during stress periods. Traditional methods may allocate across stocks, bonds, and cash based on historical averages, yet ignore how correlations tighten in downturns. In contrast, correlation-driven allocation dynamically favors assets like gold or certain alternatives that maintain independence. This leads to lower maximum drawdowns and improved Sharpe ratios over multi-year periods, though it requires more data and computational effort than simple percentage-based spreading.
Tools and Software for Correlation Analysis
Individual investors can leverage accessible platforms to perform these calculations. Spreadsheet programs allow manual matrix creation, while specialized financial software offers automated rolling correlations and scenario modeling. Free resources from established providers enable users to download historical price series and compute coefficients without advanced programming knowledge. Institutional tools add features such as multi-asset optimization engines and real-time alerts when correlations breach predefined thresholds, helping maintain portfolio integrity throughout 2026.
Actionable Tips for 2026
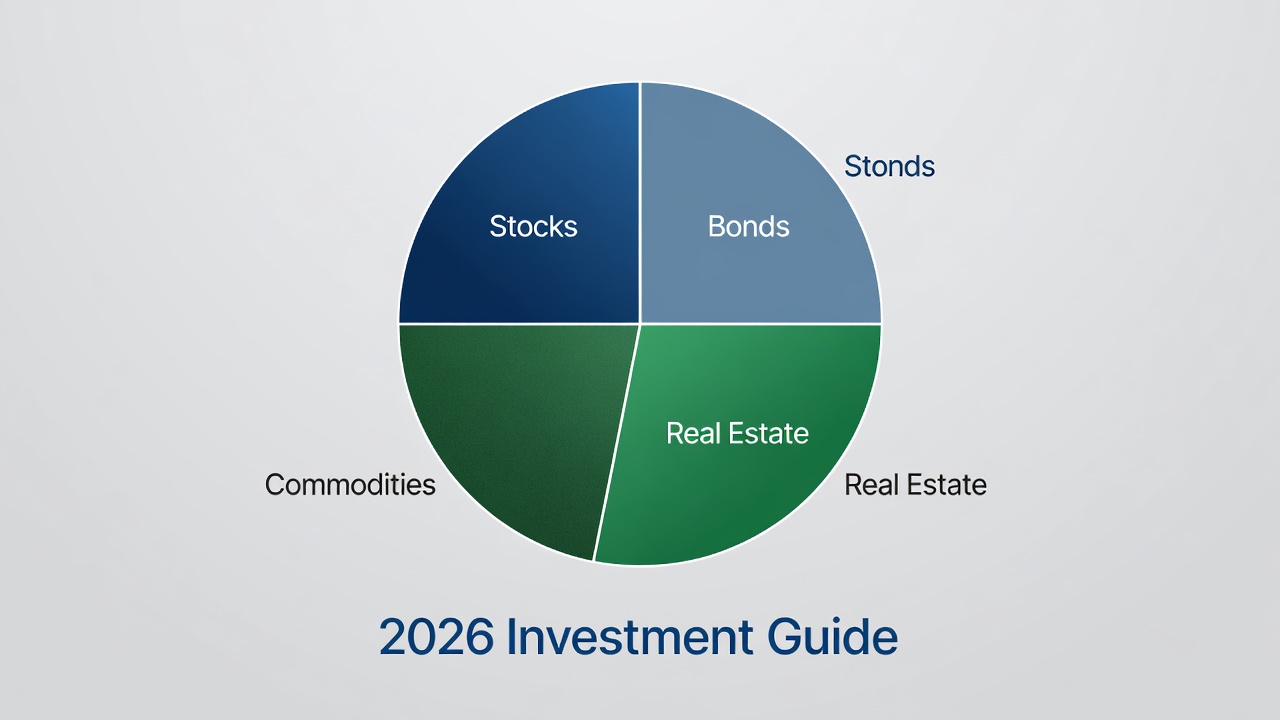
Start with core holdings of equities and bonds, then layer in commodities or alternatives with demonstrated low correlations. Use free correlation calculators from reputable financial data providers. Revisit allocations after major economic data releases. Consider currency-hedged international assets to further decorrelate returns. Document your correlation assumptions to refine the process over time. Incorporate environmental, social, and governance factors that may influence future correlations. Avoid over-reliance on short-term data by blending multiple time horizons. Finally, consult educational materials from Investopedia and research reports available at Federal Reserve for deeper context on evolving market dynamics.
Frequently Asked Questions
How often should investors update correlation data?
Review correlations at least quarterly, with more frequent checks during periods of elevated market volatility or after significant policy announcements.
Can correlation-based allocation eliminate all risk?
No method removes risk entirely, but correlation analysis significantly lowers portfolio drawdowns compared with naive diversification by targeting independent return streams.
Are there tools available for individual investors?
Many brokerage platforms and sites such as Investopedia offer free or low-cost correlation tools and educational resources suitable for retail use.
Does this strategy work for retirement accounts?
Yes. Correlation-based allocation applies equally to IRAs and 401(k)s, helping participants manage sequence-of-returns risk through more stable growth patterns.
What limitations exist in correlation analysis?
Correlations can break down during black swan events, so investors should combine this approach with fundamental analysis and position sizing rules for robustness.
For deeper methodology, consult resources from Securities and Exchange Commission investor education sections on portfolio construction principles.
Conclusion
Correlation-based asset allocation provides a data-driven path to stronger diversification in 2026. By focusing on statistical relationships rather than asset labels alone, investors can build portfolios that better withstand uncertainty while pursuing long-term growth objectives. Implementing these techniques requires discipline and regular review but delivers meaningful improvements in risk-adjusted performance over time.

No comments yet. Be the first!