 Bullish Portfolio

Introduction to REITs for Passive Income
Real estate investment trusts (REITs) offer investors a pathway to consistent dividend income without direct property ownership. In 2026, with evolving market conditions including fluctuating interest rates and shifting tenant demands, evaluating REITs rigorously is essential for sustainable passive income. This guide covers core metrics, analysis steps, examples, and strategies to avoid common errors while building a resilient portfolio focused on long-term yields. REITs allow individuals to gain exposure to commercial real estate across sectors like industrial, residential, healthcare, and retail, providing liquidity and professional management that direct ownership cannot match. Understanding how to dissect financial statements ensures investors select vehicles capable of weathering economic cycles while delivering reliable distributions.
Understanding Key REIT Metrics
Funds from operations (FFO) measures a REIT's core earnings by adding back depreciation and amortization to net income. Adjusted FFO provides a clearer view of cash generation after accounting for recurring capital expenditures. Debt-to-equity ratios reveal leverage risk, with lower ratios indicating stability and better ability to weather economic shifts. Dividend payout ratios show sustainability; those consistently below 80% of FFO often signal reliability, allowing room for growth or unexpected downturns. Investors should also examine occupancy rates, same-store net operating income growth, and interest coverage ratios to gain a holistic view of operational health. These metrics together paint a complete picture of both current performance and future viability in income-focused strategies.
Practical Steps for Metric Analysis
- Review quarterly SEC filings for accurate FFO data and reconciliation to GAAP net income, paying close attention to footnotes that explain adjustments.
- Calculate debt-to-equity using balance sheet figures and compare to industry benchmarks published by real estate associations.
- Assess payout trends over five years, noting any adjustments during market stress periods such as the 2020 downturn or recent rate environments.
- Compare metrics against sector averages and peer REITs using standardized financial databases for apples-to-apples analysis.
- Evaluate lease expiration schedules and tenant diversification to gauge future revenue stability and concentration risks.
- Monitor macroeconomic indicators such as interest rate trends that influence borrowing costs and property valuations.
Access official filings via the SEC for primary data sources that ensure accuracy over third-party summaries. This disciplined process helps filter out REITs with unsustainable models early in the selection phase.
Analyzing Funds from Operations in Depth
FFO serves as the primary profitability gauge for REITs because traditional earnings metrics are distorted by large depreciation expenses on real estate assets. Begin by locating the FFO figure in earnings releases, then adjust for items like gains on sales or non-recurring charges. Strong REITs demonstrate year-over-year FFO growth of at least mid-single digits in stable environments. For example, industrial REITs benefiting from logistics demand often report robust FFO expansion tied to rising rental rates and new developments. Weak fundamentals appear when FFO declines despite stable revenues, signaling potential issues with expense management or asset quality. Investors can further refine this by calculating AFFO, which subtracts maintenance capex, providing the most conservative cash flow estimate for dividend forecasting.
Debt-to-Equity Ratios and Risk Management
Leverage assessment prevents overexposure to rising rates or property value fluctuations. A debt-to-equity ratio below 1.0 is generally preferable for defensive income strategies, though sector norms vary. Healthcare REITs may tolerate slightly higher leverage due to long-term leases with stable tenants, whereas retail properties require more conservative structures. Calculate this metric quarterly and track changes alongside fixed-charge coverage ratios to ensure interest payments remain manageable. Diversified funding sources, including unsecured bonds and bank facilities, further reduce refinancing risk in 2026 conditions. High leverage amplifies both gains and losses, making it critical to stress-test against scenarios where property values decline five to ten percent.
Dividend Payout Sustainability
Sustainable dividends require payout ratios that leave sufficient retained cash for maintenance and growth. Examine the ratio of dividends to FFO rather than net income. REITs with payouts exceeding 90% of FFO repeatedly face distribution cuts during recessions or rate hikes. Review dividend history for consistency and any special distributions that may not recur. Cross-reference with free cash flow after capital expenditures to confirm true coverage levels. A payout that appears covered on paper may still be vulnerable if it relies on one-time asset sales or aggressive accounting choices.
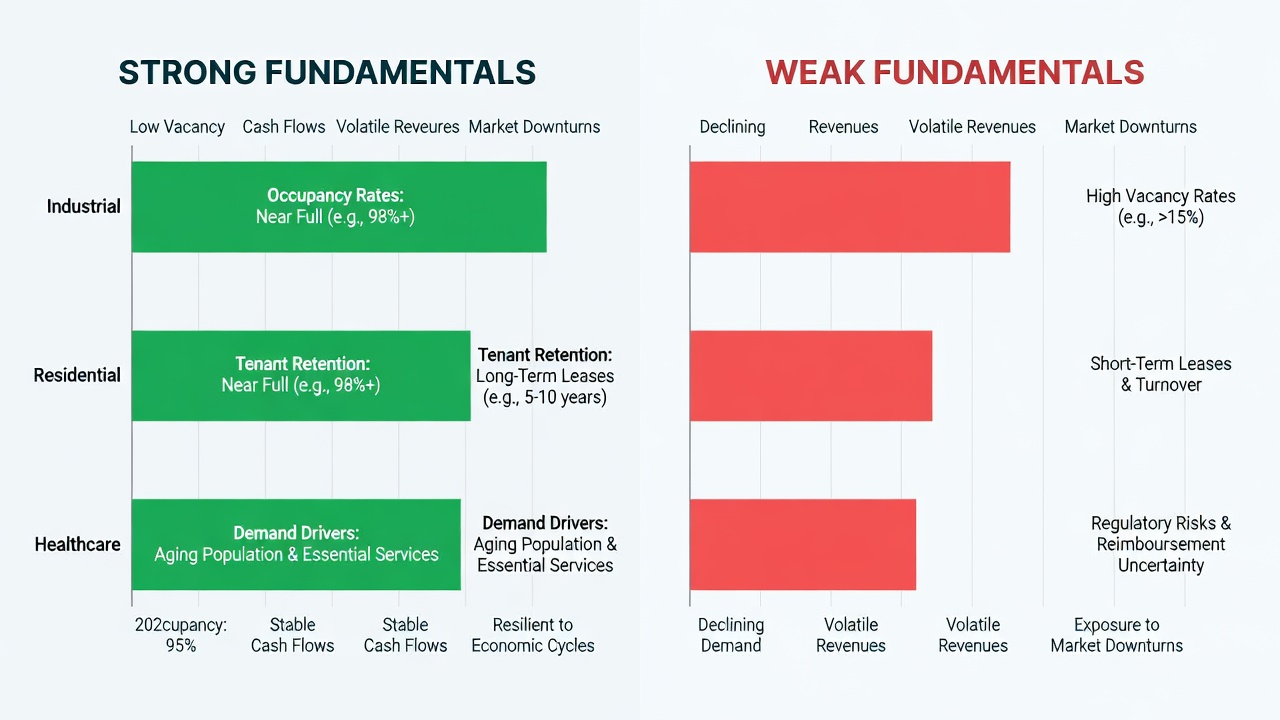
Real-World Examples of Strong vs Weak Fundamentals
Consider a REIT like Prologis with robust FFO growth and conservative debt levels, demonstrating resilience through industrial sector tailwinds and disciplined acquisitions. Its occupancy rates above 95% and diversified global tenant base support reliable distributions even amid supply chain disruptions. In contrast, over-leveraged retail REITs during downturns often face payout cuts when occupancy drops and refinancing becomes costly. These cases highlight the value of consistent metric monitoring and avoiding high-yield traps without underlying earnings strength. Another example involves data center REITs showing exceptional FFO expansion from technology demand and AI infrastructure needs, versus certain office REITs struggling with hybrid work trends and higher vacancy rates that erode net operating income. A healthcare REIT with medical office buildings leased to creditworthy hospital systems illustrates defensive characteristics, maintaining steady FFO through demographic tailwinds.
Comparing Growth Potential Across Property Sectors
Industrial and data center REITs show strong growth potential due to e-commerce and tech demand, often posting higher FFO growth rates supported by long-term leases and development pipelines. Residential sectors offer stability but face interest rate sensitivity affecting mortgage costs for tenants and new construction. Healthcare REITs provide defensive yields amid demographic shifts toward aging populations requiring medical facilities and senior housing. Office properties may lag unless located in high-demand urban cores with strong lease renewals and amenity upgrades. Retail REITs tied to necessity-based tenants like grocery stores tend to outperform those focused on discretionary spending. Investors should compare same-store NOI growth across sectors using reports from the Federal Reserve for broader economic context on inflation and employment trends influencing each property type. Sector rotation based on these comparisons can enhance portfolio resilience.
Avoiding Common Pitfalls in 2026 Market Conditions
Investors often overlook rising interest rate impacts on debt servicing and cap rates. Focus on diversified portfolios and avoid chasing high yields without FFO backing. Monitor occupancy rates and lease expirations closely for forward visibility. Another frequent mistake is ignoring geographic concentration risk, such as overexposure to single-state markets vulnerable to local regulations or natural disasters. Always stress-test models against scenarios of prolonged high rates or recessionary occupancy declines. Additionally, failing to review management quality and governance practices can lead to value-destructive decisions like empire-building acquisitions. Finally, neglecting environmental, social, and governance factors may expose portfolios to future regulatory or reputational risks in an increasingly scrutinized industry.
Conclusion
Thorough REIT metric evaluation empowers sustainable passive income. By prioritizing FFO, leverage, and payout analysis, investors can navigate 2026 markets effectively while building lasting wealth through disciplined selection and ongoing monitoring.
FAQ
What are the tax considerations for REIT dividends?
REIT dividends are often taxed as ordinary income, though qualified portions may receive favorable rates. Consult IRS resources at IRS.gov for details on qualified dividend treatment and state-level implications that affect net yields. Tax-advantaged accounts like IRAs can defer or eliminate immediate tax burdens on distributions.
How should investors allocate REITs in a portfolio?
Limit REIT exposure to 10-15% for diversification, adjusting based on risk tolerance and income needs for long-term yield optimization. Rebalance annually and consider correlation with other asset classes to maintain overall portfolio stability. Younger investors may tilt toward growth-oriented sectors, while those nearing retirement prioritize defensive healthcare and residential holdings.
What role do occupancy rates play in long-term REIT viability?
Occupancy rates above 90% typically indicate strong demand and pricing power, directly supporting FFO growth and dividend coverage. Persistent vacancies signal potential issues with asset quality or location, warranting deeper due diligence before committing capital.


No comments yet. Be the first!