 Bullish Portfolio
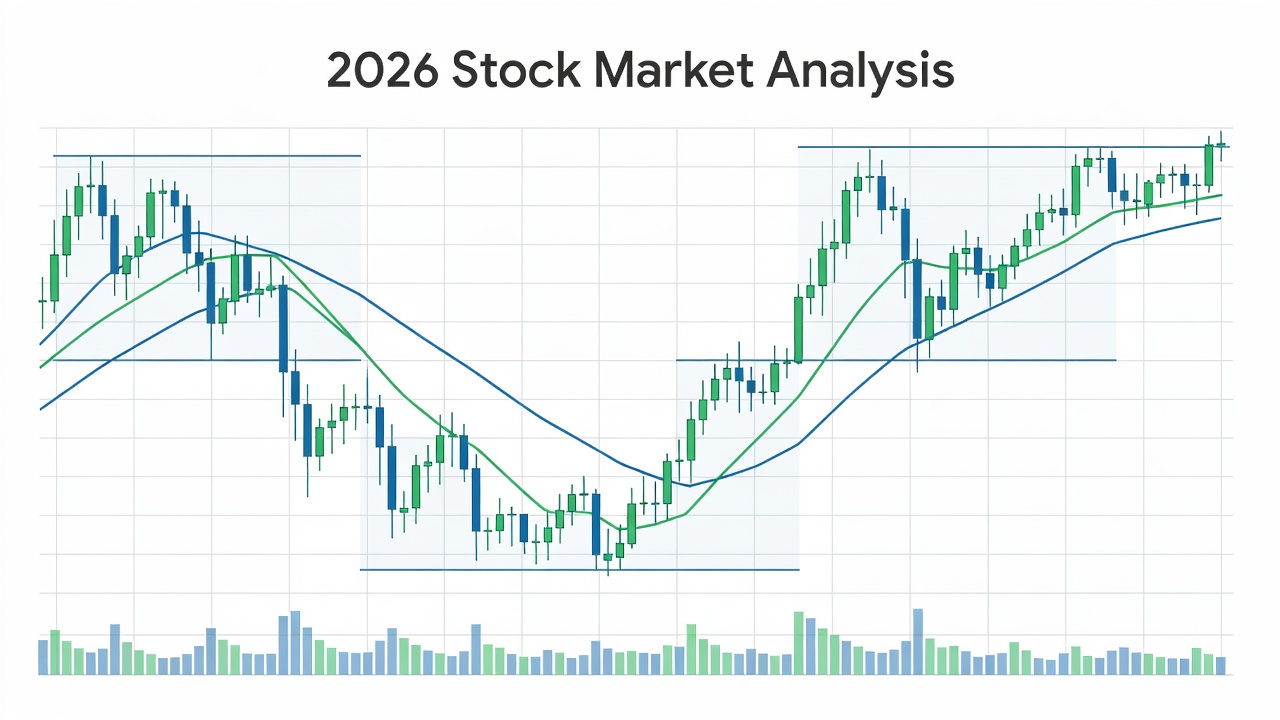
Introduction to Trend Lines and Channels in 2026
Technical analysis remains a cornerstone for traders navigating volatile markets in 2026. Trend lines and channels offer visual frameworks to identify direction, strength, and potential reversals without relying solely on lagging indicators. This guide provides in-depth steps for drawing valid lines, applying channel strategies, and integrating volume data for stronger signals. In an era dominated by high-frequency algorithms and rapid news cycles, these classic tools help traders cut through noise and focus on underlying market structure.
Traders seeking fresh perspectives beyond basic tools will find actionable methods here, including real-world chart examples and comparisons to moving averages. Whether in bull, bear, or sideways conditions, these techniques help refine entry and exit decisions while supporting disciplined risk management. The concepts build on decades of market observation yet remain highly relevant for contemporary analysis.
What Are Trend Lines and Channels?
A trend line connects successive highs or lows on a price chart to highlight the prevailing direction. An uptrend line links higher lows, while a downtrend line connects lower highs. Channels extend this concept by drawing parallel lines, forming a corridor that captures price action between support and resistance. This visual corridor reveals the boundaries within which price tends to oscillate during a trend.
These tools emphasize market psychology: buyers step in at support in uptrends, sellers defend resistance in downtrends. In 2026, with algorithmic trading influencing rapid moves, clean trend lines help filter noise and focus on structural shifts. Channels further quantify the range of acceptable price movement, allowing traders to anticipate both continuation and exhaustion points.
Identifying Valid Trend Lines
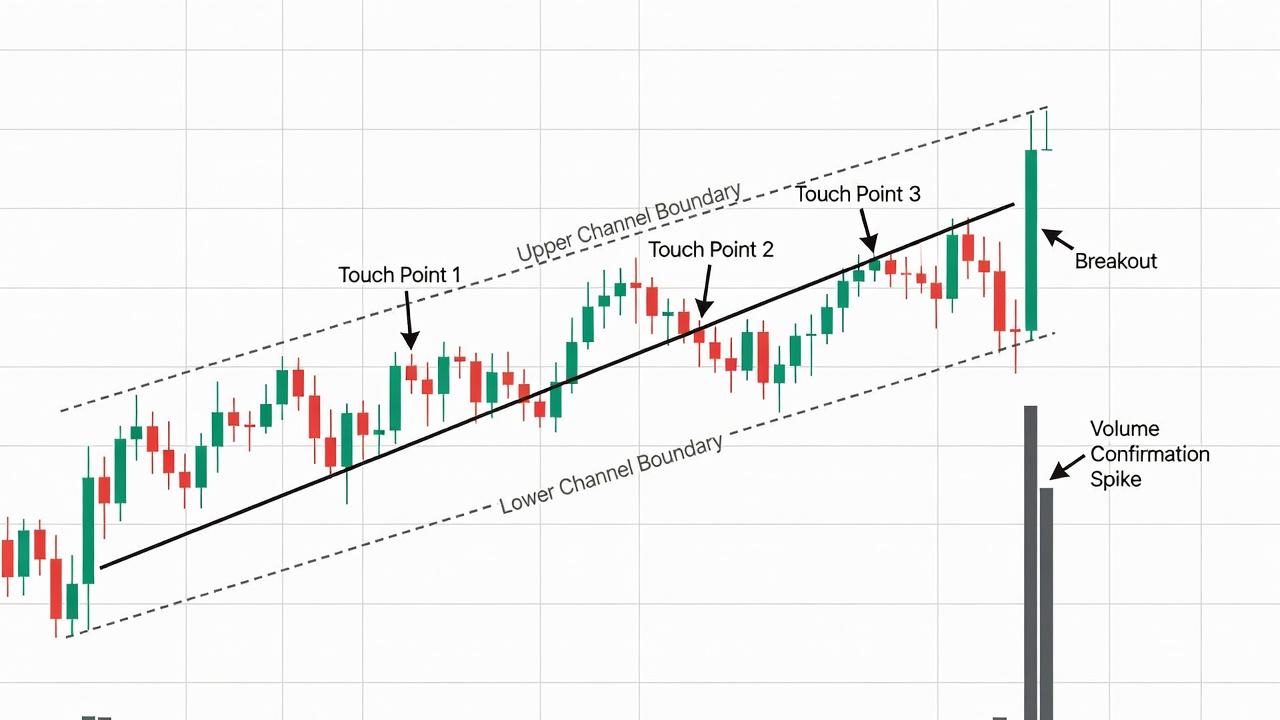
Not every line qualifies as valid. Look for at least three touch points where price respects the line without significant penetration. The more touches, the stronger the line becomes. Steep lines often break quickly, so prioritize moderate slopes that align with the overall trend. Avoid drawing lines that cut through price action or require excessive adjustment to fit recent candles.
Adjust lines as new data emerges, but avoid forcing fits. Valid lines should act as dynamic support or resistance, with bounces confirming their relevance. Breakouts accompanied by increased activity signal potential trend changes. Traders should also consider the timeframe: lines on weekly charts carry more weight than those on five-minute charts for swing trading decisions.
Drawing and Applying Channels
Start with a trend line, then draw a parallel line touching the opposite extreme (highs in an uptrend). This creates the channel. Price oscillating within the channel suggests continuation; breaks outside indicate acceleration or reversal. There are ascending channels in uptrends, descending channels in downtrends, and horizontal channels during consolidation phases.
Trading rules include buying near the lower channel line in uptrends and selling near the upper line. For range-bound channels, mean-reversion tactics work well until a breakout occurs. Always confirm channel breaks with volume and avoid entering immediately after the first breach, as false breaks remain common in choppy conditions.
Combining Trend Lines and Channels with Volume
Volume provides critical confirmation. Rising volume on bounces from trend lines strengthens the signal, while declining volume warns of weakening momentum. In channels, volume spikes at boundaries often precede breakouts. Divergences between price and volume frequently highlight impending shifts before they appear on the price chart alone.
Monitor volume trends alongside price structure. For example, a channel breakout on below-average volume may lack follow-through, whereas the same breakout on surging volume suggests institutional participation. Resources from institutions like the U.S. Securities and Exchange Commission underscore the importance of transparent market data for accurate volume interpretation.
Step-by-Step Examples from Recent Charts
Consider a major tech stock in early 2026: connect the March low to the June low for an uptrend line. The parallel channel upper boundary captures the July peak. Price tested the lower line in August with rising volume, offering a long entry before resuming the climb. Traders would place stops just below the trend line and target the upper channel boundary for exits.
Another example involves an energy sector name in a downtrend channel. Lower highs formed the upper line, with the lower parallel guiding short entries on rallies. A volume-backed break above the upper line in September signaled the channel's end and trend reversal. Monitoring the Federal Reserve announcements during this period helped contextualize the broader market shift that supported the breakout.
A third illustration from the financial sector shows a horizontal channel lasting several weeks. Traders bought at the lower boundary and sold at the upper boundary repeatedly until a decisive volume increase pushed price outside the range, marking the start of a new directional move.
Comparing Trend Lines and Channels to Moving Averages
Moving averages smooth price data but lag behind current action. Trend lines and channels react faster to structural changes because they are drawn directly from price extremes. While moving averages excel in strong trends for trailing stops, channels better define boundaries for range trading.
Many traders combine both: use a 50-day moving average to gauge overall bias, then overlay trend lines for precise levels. This hybrid approach reduces false signals common with indicators alone. Channels also provide clearer profit targets compared to moving-average crossovers, which can occur late in a move.
Common Mistakes to Avoid
- Drawing lines through too few points or ignoring outliers that invalidate the structure.
- Over-adjusting lines after every minor move, reducing objectivity and leading to curve-fitting.
- Ignoring volume when assessing breakout validity, resulting in entries on weak momentum.
- Trading against the larger trend when using short-term channels, which increases risk of being caught in a counter-move.
- Expecting perfect adherence; minor wick breaches are normal in volatile sessions and should not automatically invalidate a line.
- Neglecting higher-timeframe confirmation, causing traders to miss the broader context of the move.
Practical Tips for Different Market Conditions
In strong bull markets, favor long positions on lower channel tests and trail stops along the trend line. Bear markets reward shorting upper channel touches while maintaining tight risk controls. Sideways conditions suit mean-reversion within wide channels until a decisive volume-supported break occurs.
During earnings seasons or macroeconomic events, widen channel expectations and wait for post-event confirmation. Always align channel trades with higher-timeframe trend lines for confluence. In low-volume holiday periods, reduce position size because false breaks become more frequent. Volatile environments benefit from waiting for retests of broken lines before committing capital.
Risk Management Considerations
Effective use of trend lines and channels requires strict risk rules. Determine position size based on the distance from entry to the invalidation point beyond the line. Never risk more than a small percentage of capital on any single setup. Use alerts to monitor line touches rather than watching charts constantly, reducing emotional decision-making.
Frequently Asked Questions
How reliable are trend lines and channels in 2026?
They remain effective when validated by multiple touches and volume, though no tool guarantees outcomes. Combine with broader market context for best results and always employ stop-loss orders.
Can these tools work on all timeframes?
Yes, but daily and weekly charts produce cleaner lines with fewer false breaks than intraday frames. Scalpers may adapt them on shorter intervals with added filters.
Should beginners start with channels or simple trend lines?
Master basic trend lines first, then progress to channels once comfortable identifying support and resistance. This progression builds foundational pattern-recognition skills.
Do trend lines and channels require software?
Most charting platforms include drawing tools, but manual construction on paper or simple spreadsheets can deepen understanding before relying on automation.
Conclusion
Trend lines and channels deliver timeless structure to 2026 stock analysis. By focusing on valid identification, volume confirmation, and disciplined rules, traders gain an edge beyond standard indicators. Practice on historical charts, apply the step-by-step methods outlined, and integrate these tools into a broader strategy for consistent decision-making. Continued study and real-time application will refine your ability to read market structure effectively.
Explore more proven approaches in our investment strategies section.
No comments yet. Be the first!