 Bullish Portfolio
Introduction to Elliott Wave Theory in Modern Markets
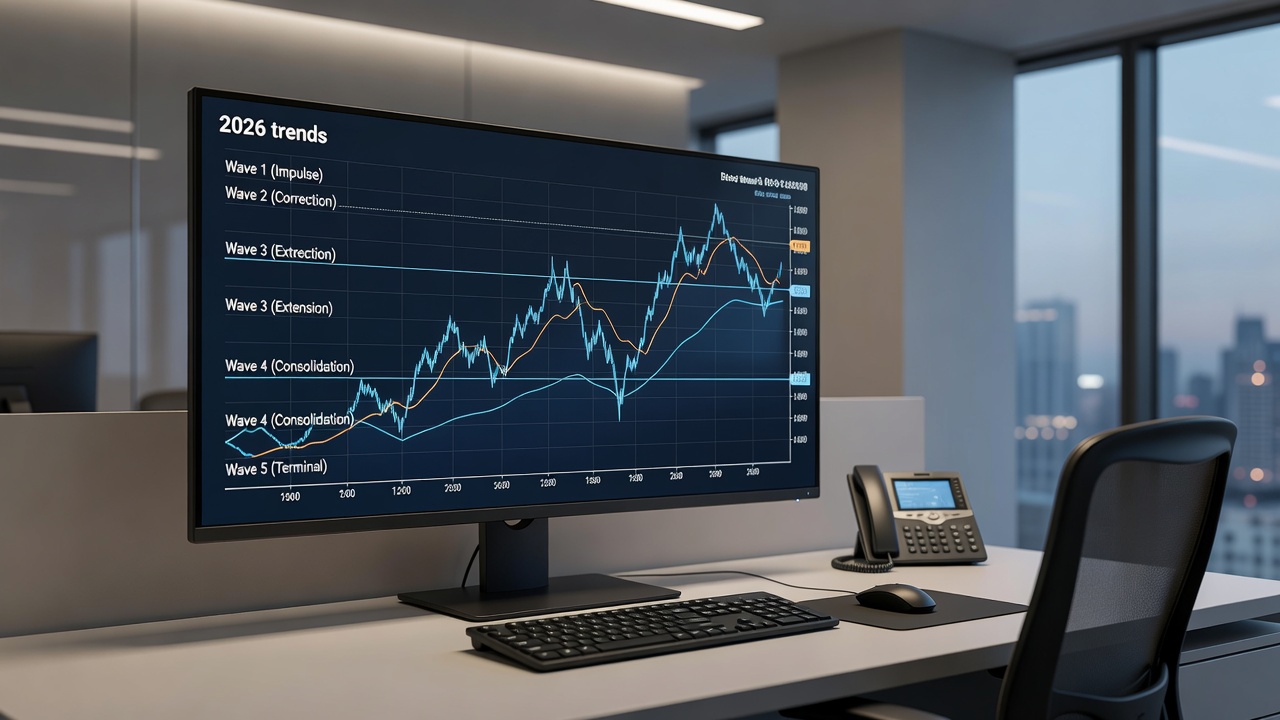
Elliott Wave Theory provides a structured framework for analyzing market psychology through recurring wave patterns. For traders preparing for 2026, this approach moves beyond simple moving averages by mapping crowd behavior in five-wave impulse sequences and three-wave corrections. The theory, developed in the 1930s, remains relevant because human emotions driving buying and selling have not changed. Markets in 2026 are expected to face heightened volatility from geopolitical events, technological disruptions, and shifting monetary policies, making wave-based analysis particularly valuable for identifying turning points that standard indicators often miss.
Advanced traders value its ability to project price targets and reversal zones when combined with other tools. In volatile sectors such as technology and energy, wave counts can highlight trend shifts before they appear on standard indicators. This method emphasizes that markets move in repetitive cycles driven by collective optimism and pessimism, allowing prepared traders to position ahead of major moves rather than reacting after the fact.
Understanding Impulse and Corrective Waves
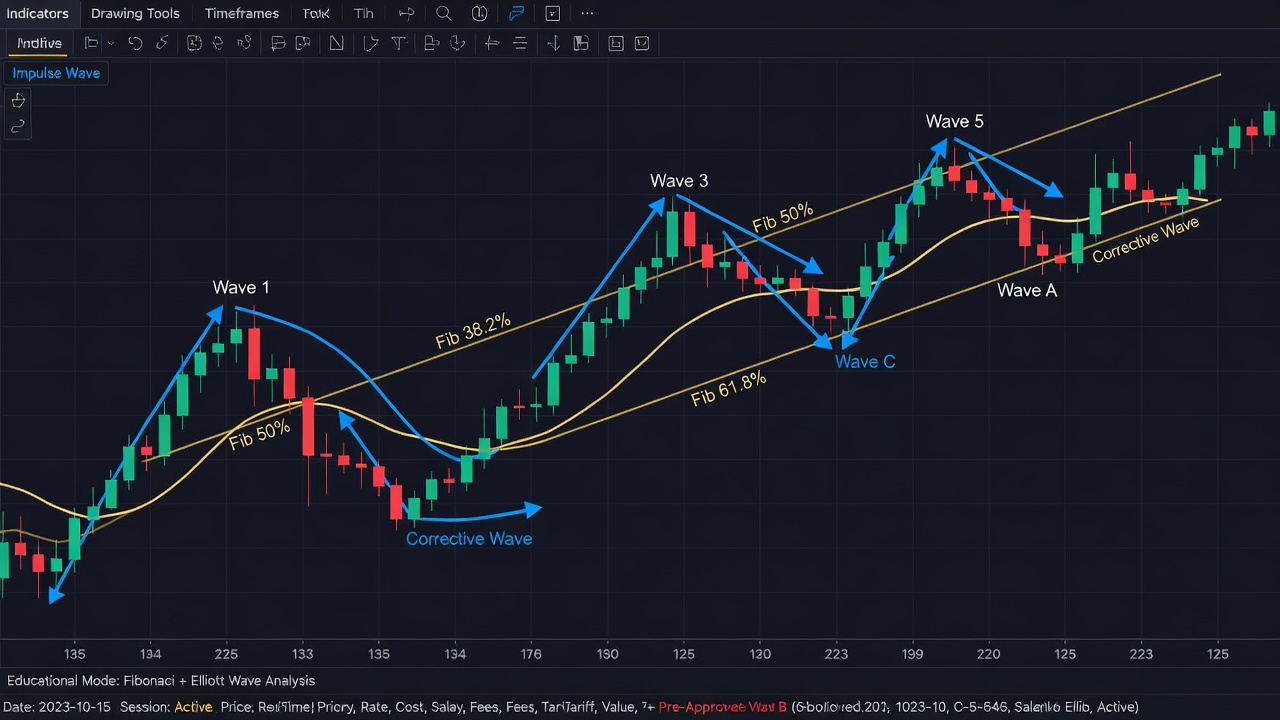
Impulse waves consist of five sub-waves moving in the direction of the larger trend. Waves 1, 3, and 5 are motive, while waves 2 and 4 represent retracements. Corrective waves follow in three sub-waves labeled A-B-C and move against the trend. Recognizing these structures on daily and weekly charts helps traders anticipate the end of trends. Within impulse waves, wave 1 often begins quietly after a long correction, wave 3 typically accelerates with strong participation, and wave 5 shows signs of exhaustion such as narrowing spreads between highs.
Wave 3 typically shows the strongest momentum and often extends. Wave 5 can become extended in strong bull markets but may also truncate, signaling exhaustion. Corrective patterns include zigzags, flats, and triangles, each carrying different implications for the next impulse. Zigzags feature sharp, deep retracements while flats remain more sideways, and triangles indicate consolidation before a breakout. Understanding these variations prevents mislabeling during complex 2026 market conditions where news events can temporarily distort patterns.
Applying Fibonacci Ratios Within Wave Structures
Fibonacci ratios provide precise measurement tools for wave relationships. Wave 2 often retraces 50% to 61.8% of wave 1. Wave 3 commonly extends 161.8% of wave 1. Wave 4 typically retraces 38.2% of wave 3. These ratios help set realistic price targets and stop-loss levels. Traders can apply extensions to wave 5 projections using 61.8% or 100% of the distance from wave 1 through wave 3, creating confluence zones where multiple measurements intersect.
Traders plot these levels on candlestick charts to identify confluence zones where multiple wave projections align. This method adds objectivity to wave counting and reduces subjective interpretation. In practice, combining Fibonacci with wave counts allows for tighter risk management, such as placing stops just beyond the 78.6% retracement level if a count appears invalid. For 2026 forecasts, these tools become essential when projecting targets in sectors experiencing rapid innovation cycles.
Combining Wave Counts with Volume Data for Confirmation
Volume analysis strengthens wave identification. Impulse waves should show increasing volume, especially in wave 3. Declining volume during wave 5 often warns of a weakening trend. Corrective waves usually occur on lower volume, confirming the move is temporary. Divergences between price and volume, such as higher prices with lower volume in wave 5, frequently precede reversals and prompt traders to tighten stops or prepare for corrective phases.
Traders monitor volume spikes at wave terminals to validate reversals. When volume diverges from price action, wave counts may need adjustment before the next 2026 trend shift. Integrating volume oscillators or on-balance volume indicators with wave counts adds another layer of confirmation, helping distinguish between genuine impulse moves and false breakouts common in high-frequency trading environments.
Step-by-Step Wave Labeling on Charts
Start with the higher time frame to identify the larger degree wave. Mark the start and end of the most recent clear impulse. Count sub-waves from left to right, ensuring wave 3 is not the shortest. Apply Fibonacci retracements to validate labels. Adjust counts only when new price data clearly invalidates the prior structure. Next, examine intermediate time frames to confirm sub-wave relationships and look for supporting volume patterns. Finally, develop alternate counts for bullish and bearish scenarios to remain flexible as new data arrives.
Repeat the process on lower time frames for entry timing. Always maintain alternate counts for different scenarios. Documenting each labeling decision with annotated screenshots helps track how counts evolve, which is useful when reviewing performance over multi-month periods in 2026.
Real-World Case Studies from Volatile Sectors
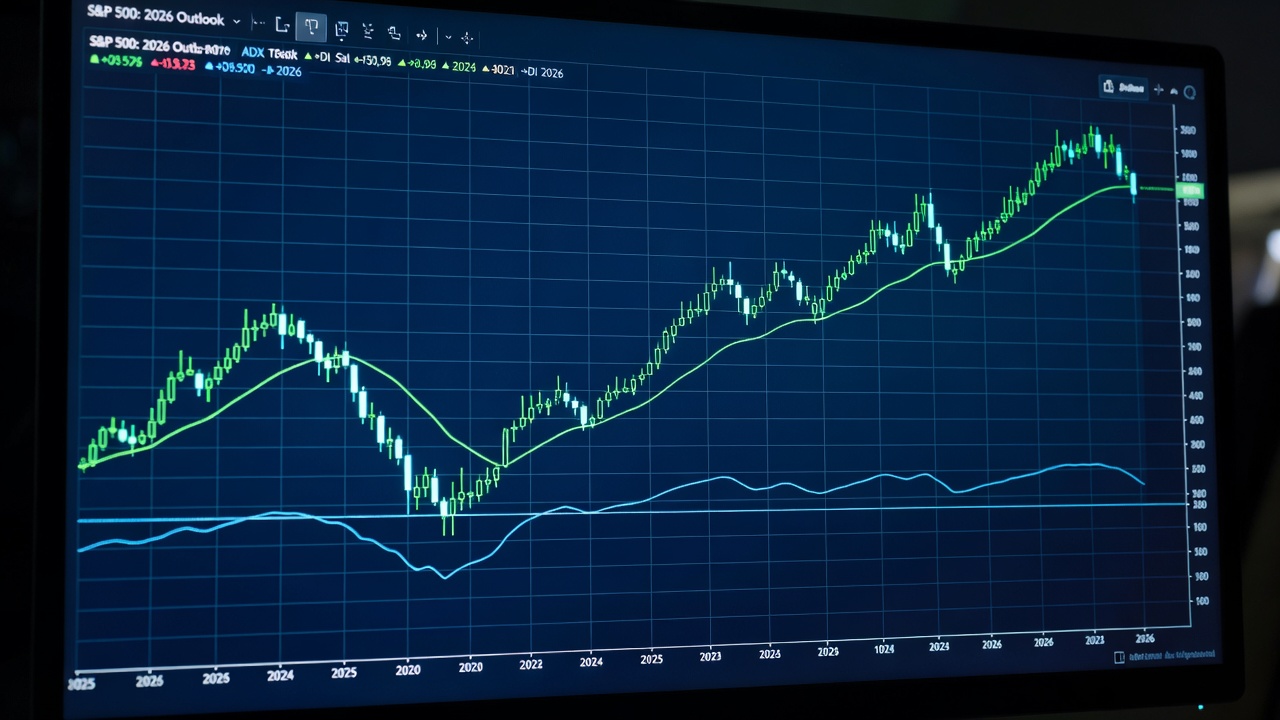
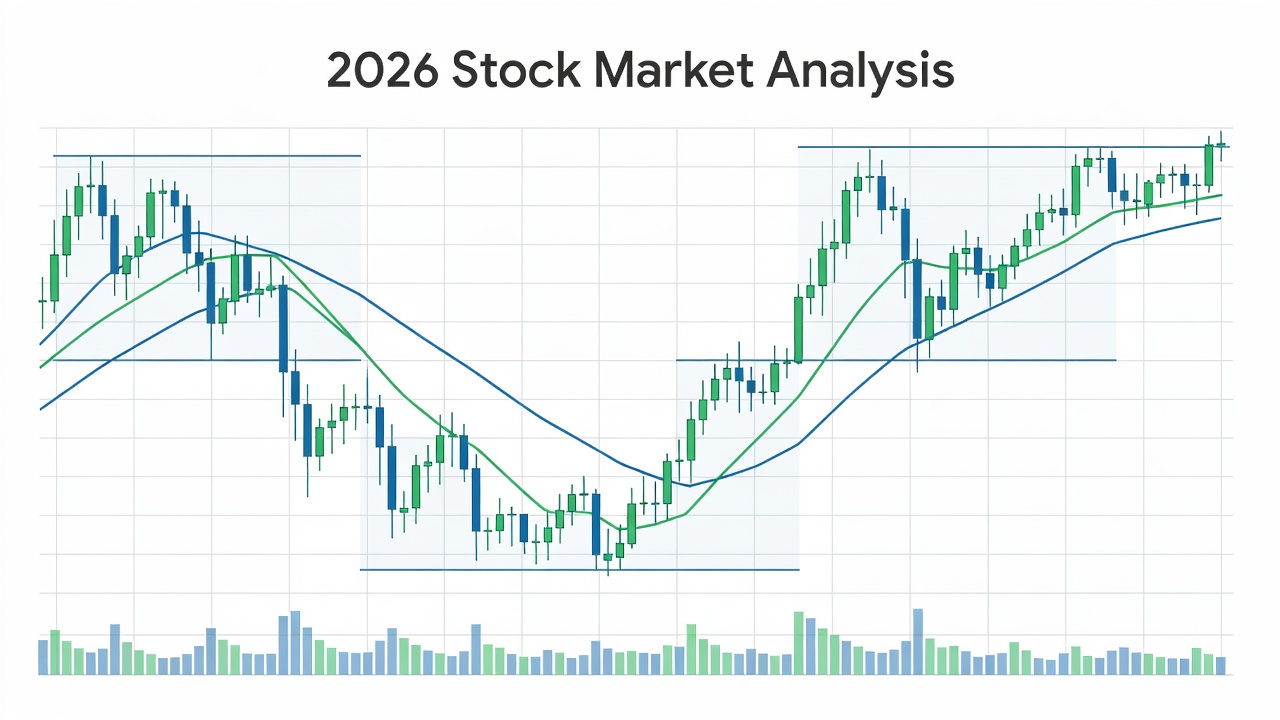
In the semiconductor sector during 2022-2023 volatility, a completed five-wave advance followed by an ABC correction accurately projected the subsequent recovery. Energy stocks in 2024 showed extended wave 3 behavior confirmed by rising volume, allowing traders to ride the move with defined targets. During the 2020 market crash and rebound, technology stocks displayed clear impulse waves with wave 3 extensions that aligned closely with Fibonacci projections, providing high-probability entry points for those who adjusted counts promptly after initial breakdowns.
These examples illustrate how wave analysis captures sector rotations ahead of broader indices. In each case, combining wave counts with volume spikes at wave 3 peaks helped filter out noise from macroeconomic headlines. Traders who applied these methods avoided premature entries during corrections and captured larger portions of the subsequent impulses.
Strategies for Timing Entries During 2026 Trend Shifts
Enter long positions near the end of wave 4 corrections when Fibonacci support and volume stabilization align. Scale out during wave 5 extensions. Use wave C completion in corrections for short entries or hedging. Maintain strict risk rules by placing stops beyond the start of the prior wave. Position sizing should reflect the strength of confluence between wave counts, Fibonacci levels, and volume, with smaller sizes used when alternate counts remain viable.
Monitor macroeconomic catalysts that may accelerate wave completion in 2026. Setting alerts at key Fibonacci levels and reviewing weekly volume profiles can improve timing precision. Backtesting these combined strategies on historical sector data builds confidence before applying them to live 2026 positions.
Common Pitfalls to Avoid
- Overcounting waves on noisy lower time frames without higher-degree confirmation, which leads to frequent revisions and whipsaw trades.
- Ignoring volume divergence that signals invalid wave structures, often resulting in holding positions past logical exit points.
- Forcing counts during sideways markets where triangles or complex corrections develop, causing traders to miss the true breakout direction.
- Failing to update alternate counts when new highs or lows invalidate the primary scenario, leaving portfolios exposed during sudden reversals.
Another frequent mistake involves neglecting the larger degree trend when focusing on short-term counts, which can turn profitable trades into losers when a higher-degree correction begins.
FAQ: Wave Count Adjustments in Fast-Moving Markets
How often should wave counts be revised?
Revise counts whenever price breaks key wave origins or violates Fibonacci relationships. In fast markets, review counts at the close of each week and after major economic releases.
What indicates an incorrect wave count?
Wave 3 becoming shorter than wave 1 or volume failing to support the assumed impulse direction are strong signals to reconsider the labeling. Persistent overlap between waves 1 and 4 also suggests the count needs adjustment.
Can Elliott Wave Theory be used alone?
Best results occur when combined with volume, sentiment data, and broader economic context. Relying solely on wave patterns increases the risk of mislabeling during news-driven moves common in 2026.
How do traders handle diagonal triangles in wave 5?
Diagonal triangles often appear in fifth waves and signal exhaustion. Traders watch for contracting ranges and declining volume to time exits before the corrective wave begins.
What role does sentiment play in wave validation?
Extreme bullish or bearish sentiment readings at wave terminals can confirm wave completions, especially when they coincide with Fibonacci targets and volume shifts.
For further reading on technical analysis frameworks, consult Investopedia, resources from the U.S. Securities and Exchange Commission, and guidance available at Federal Reserve.
Conclusion
Elliott Wave Theory equips advanced traders with a disciplined method for navigating 2026 market trends by focusing on wave structure, Fibonacci relationships, and volume confirmation. Through consistent application and careful avoidance of common pitfalls, traders can improve entry timing and risk management across volatile sectors. Regular practice on historical charts builds the experience needed to adapt counts quickly in fast-moving conditions.
No comments yet. Be the first!