 Bullish Portfolio
Introduction to ADX in Modern Stock Analysis
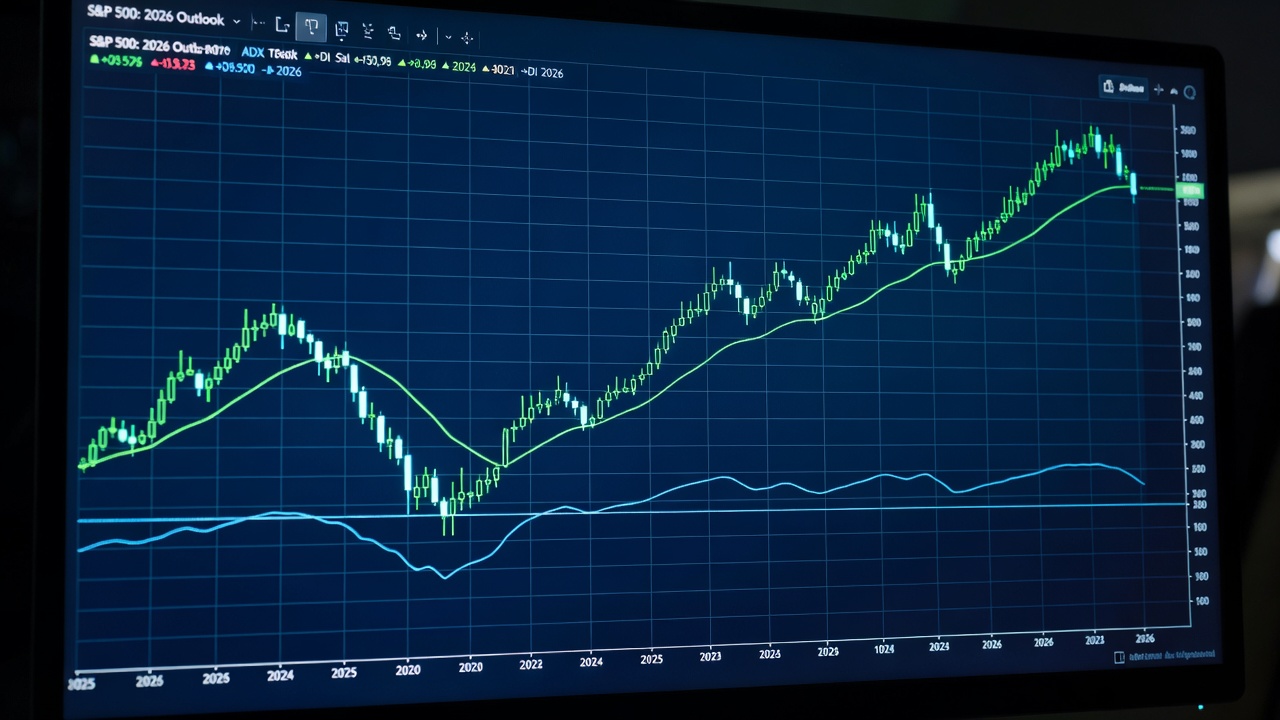
The Average Directional Index (ADX) remains one of the most reliable tools for assessing trend strength in stock markets. As we navigate 2026 market conditions, understanding ADX helps traders distinguish between strong directional moves and choppy, ranging environments. This guide provides a complete walkthrough of calculating, interpreting, and applying ADX alongside the Positive Directional Indicator (+DI) and Negative Directional Indicator (-DI). Traders often combine ADX readings with moving averages to generate precise entry signals while avoiding false breakouts during periods of elevated volatility. Whether analyzing major indices like the S&P 500 or individual equities, ADX delivers objective data on trend momentum that can improve decision-making across various market regimes.
ADX was developed by J. Welles Wilder and has stood the test of time because it focuses purely on trend strength rather than direction. In 2026, with markets influenced by geopolitical shifts, interest rate policies, and technological advancements in trading algorithms, the indicator's ability to filter noise becomes even more valuable. This article explores every aspect in depth so you can integrate it confidently into your technical analysis workflow.
Understanding the Components: ADX, +DI, and -DI
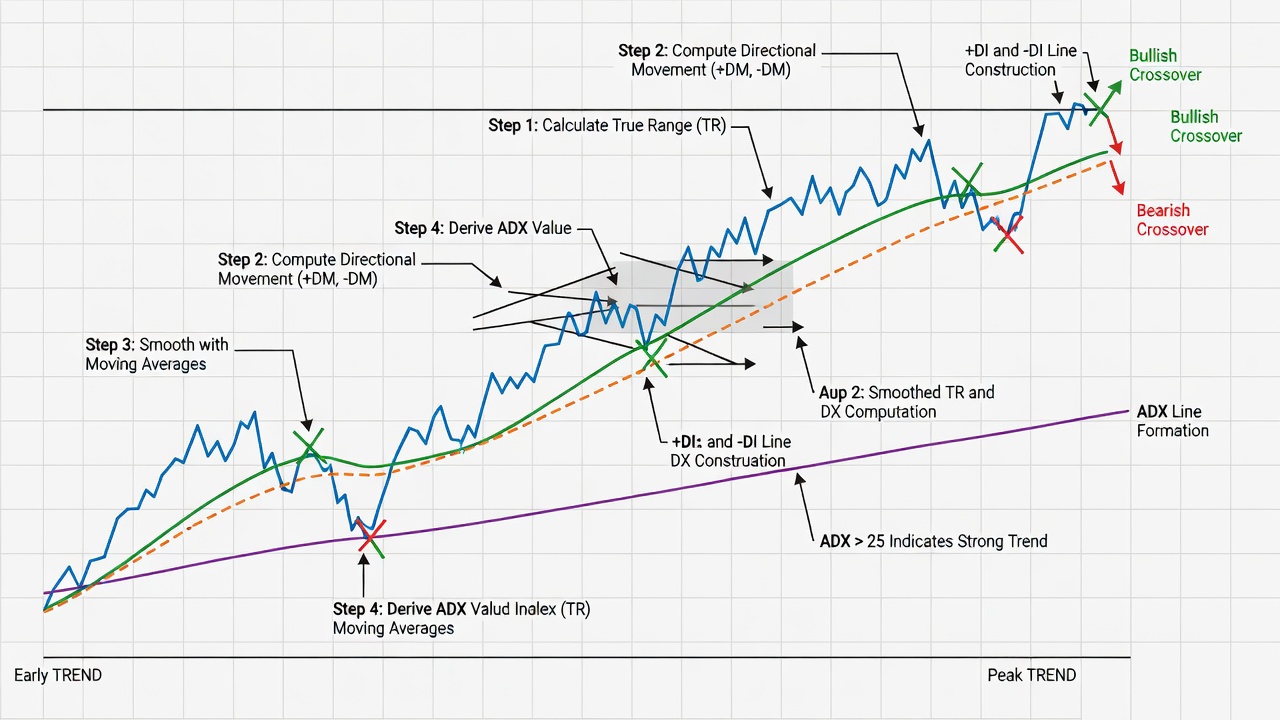
The ADX itself measures trend strength on a scale from 0 to 100, independent of direction. Values above 25 typically indicate a strong trend, while readings below 20 suggest a weak or non-trending market. The +DI line tracks upward price movement strength, and the -DI line tracks downward movement. When +DI crosses above -DI, it signals potential bullish momentum. The opposite crossover points to bearish pressure. ADX rising alongside these crossovers confirms the trend has conviction, helping traders avoid entering positions in low-conviction environments that often lead to whipsaws.
Traders should monitor the spacing between +DI and -DI as well. Wide separation combined with rising ADX points to a powerful, sustained move, whereas narrowing lines even with moderate ADX may indicate an impending consolidation phase.
Step-by-Step Calculation of ADX
Calculating ADX involves several stages using 14-period averages, though many charting platforms automate this process. Begin by computing the True Range, then derive directional movements. Smooth these values over 14 periods to obtain +DI and -DI. Finally, the ADX formula averages the absolute difference between +DI and -DI, divided by their sum, multiplied by 100. For hands-on practice, load a daily chart of the Nasdaq Composite and apply the ADX indicator with default settings. Observe how the lines behave during the 2025-2026 transition period, noting how ADX spiked above 35 during the strong upward leg in early 2026 before moderating.
Manual calculation builds deeper intuition. Start with daily high, low, and close data. Compute +DM and -DM based on whether the current high-low range expands upward or downward compared to the prior period. Smooth over 14 bars and normalize. Many platforms like TradingView allow toggling between different smoothing periods, so experiment to see how a 20-period version smooths out short-term noise in volatile 2026 sessions.
Interpreting ADX Values for 2026 Markets
In current conditions, ADX thresholds can shift slightly between bull and bear scenarios. A reading of 30 or higher often marks robust trends in bullish environments, while bear markets may require readings above 35 for confirmation due to sharper reversals. Always cross-reference with volume and broader market breadth indicators. For example, during the March 2026 correction in the Dow Jones Industrial Average, ADX climbed above 40 while price fell sharply, confirming the bearish trend strength before a relief rally began.
Comparison of ADX Thresholds
- Bull market strong trend: ADX 25-45, ideal for trend-following strategies
- Bear market strong trend: ADX 30-50, often accompanied by higher volatility spikes
- Ranging market signal: ADX below 20 for extended periods, suggesting mean-reversion approaches
- Trend exhaustion warning: ADX peaks above 50 followed by decline, even if price continues in the prior direction
Combining ADX with Moving Averages for Entry Signals
Pairing ADX with a 50-period and 200-period simple moving average creates powerful confluence. Look for ADX rising above 25 while price holds above the 200 SMA for long entries. Add the +DI/-DI crossover as the final trigger. This approach filters out many false breakouts common in 2026's volatile sessions driven by macroeconomic data releases. On the S&P 500 weekly chart, such setups captured the sustained rally from late 2025 into mid-2026 with minimal drawdowns when ADX remained elevated.
Advanced users can incorporate exponential moving averages or the 20-period EMA for faster signals in shorter timeframes. Always wait for ADX confirmation rather than entering solely on moving average crossovers to reduce false signals.
Spotting Trend Exhaustion and Avoiding False Breakouts
Trend exhaustion often appears when ADX reaches extreme levels and begins to roll over, even if price continues higher. Watch for divergences between ADX and price action. During earnings seasons or geopolitical events, ADX staying below 20 warns against breakout trades. In one notable 2026 example, the Russell 2000 showed price breaking to new highs while ADX declined from 45 to 22, correctly signaling the move lacked sustainability and foreshadowing a 12% pullback.
Practical tip: Reduce position size when ADX hovers between 15 and 25 during news-heavy weeks. Combine with support and resistance levels from higher timeframes to further validate entries.
Practical Tips for Integrating ADX into Technical Setups
Start by applying ADX to higher timeframes like daily or weekly charts for overall bias, then drill down to 15-minute or hourly charts for precise entries. Test different periods (14 vs 20) on Investopedia backtesting resources. Maintain strict risk parameters, such as stopping out if ADX falls below 20 after entry. Another effective method involves layering ADX on sector ETFs to gauge relative strength across the market. For instance, comparing ADX values between technology and energy sectors in 2026 helped identify leadership rotation early.
Common mistakes include ignoring the direction of +DI and -DI when ADX is high, or forcing trades in low ADX environments. Always align position sizing with the strength reading and consider broader context from economic calendars.
Conclusion
Mastering ADX equips traders with a quantitative edge for 2026 stock trend analysis. By focusing on strength rather than direction alone, you can improve timing and reduce exposure to false moves. Consistent practice on major indices builds confidence before applying the indicator to individual positions. Review historical charts regularly and paper trade new combinations to refine your approach.
FAQ
What timeframe works best for ADX in 2026?
Daily charts provide the most reliable signals for swing trading, while weekly charts suit longer-term investors. Intraday traders can use 60-minute charts but should require higher ADX confirmation levels above 30 to filter noise. Multi-timeframe analysis, starting from weekly down to daily, yields the best results according to many professional traders.
How should risk parameters adjust with ADX readings?
When ADX exceeds 30, consider wider stops to accommodate trend momentum. In low ADX environments below 20, tighten stops or avoid new positions entirely to manage chop risk. Position sizes can be scaled up proportionally with rising ADX values up to a personal risk limit.
Can ADX be used effectively with other indicators?
Yes, combining ADX with RSI for overbought/oversold confirmation or with volume profile tools enhances accuracy. Avoid overloading charts; focus on two or three complementary indicators maximum for cleaner decision-making in fast-moving 2026 markets.


No comments yet. Be the first!