 Bullish Portfolio
Introduction to On-Balance Volume in 2026 Markets
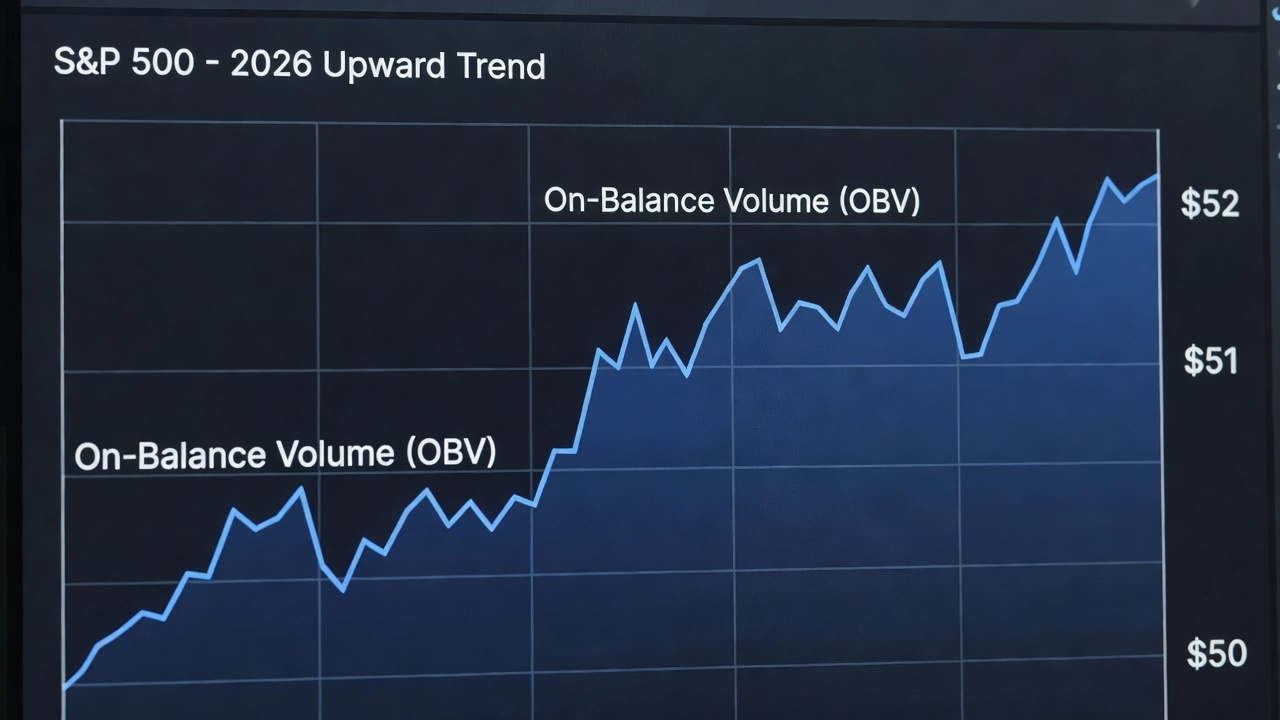
As stock markets evolve in 2026, traders need tools that go beyond basic moving averages and oscillators. On-Balance Volume (OBV) stands out as a leading volume-based indicator that helps confirm trends and identify accumulation or distribution phases before price shifts occur. This guide provides actionable strategies for using OBV to analyze sustainable market moves with concrete examples drawn from major indices.
Volume analysis has long been a cornerstone of technical trading because price movements alone can be misleading without confirmation from trading activity. In 2026, with increased algorithmic trading and global market interconnectedness, OBV offers a simple yet powerful way to gauge whether institutional players are building positions or exiting them. By focusing on the relationship between price closes and volume, traders can anticipate breakouts or breakdowns with greater confidence.
What Is On-Balance Volume and How to Calculate It
OBV measures buying and selling pressure by adding volume on up days and subtracting it on down days. The formula is straightforward: if the close is higher than the previous close, add today's volume to the running total; if lower, subtract it; if unchanged, the total stays the same. This cumulative approach creates a running line that often leads price action.
To illustrate, consider a hypothetical stock over five trading days. Day 1 closes at $50 with 1 million shares traded. Day 2 closes at $52 with 1.2 million shares, so OBV becomes +1.2 million. Day 3 closes at $51 with 800,000 shares, subtracting to reach +400,000. Continuing this process builds the OBV line that reveals underlying strength or weakness.
Traders can set this up in most charting platforms by selecting the OBV indicator from the volume tools menu. Start with daily charts of major indices like the S&P 500 or Nasdaq Composite for reliable signals. Adjust the source data to match exchange-reported volume for accuracy.
Interpreting OBV Readings for Trend Confirmation
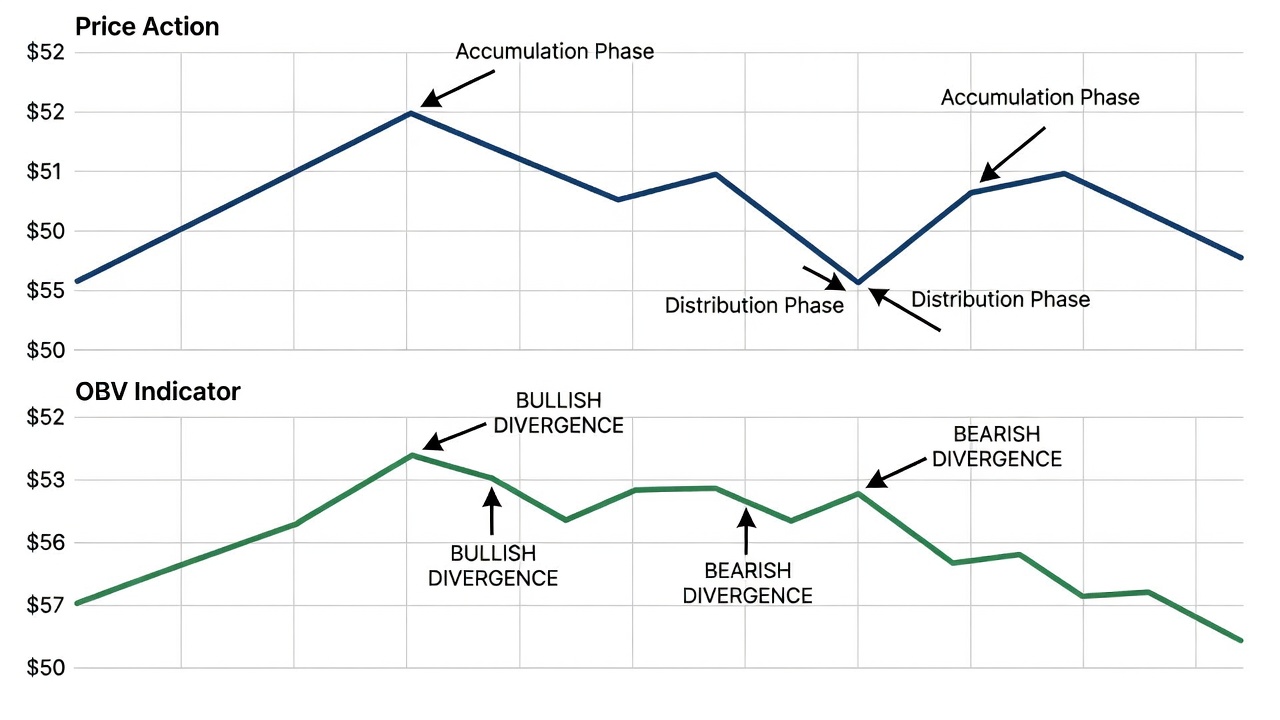
A rising OBV line alongside rising prices confirms bullish momentum, indicating strong accumulation. Conversely, a falling OBV with declining prices signals distribution. When OBV diverges from price, it often precedes reversals, giving traders an early warning system.
Understanding these readings requires context from the broader market environment. In bull markets, consistent OBV uptrends validate sustained buying interest, while flat or declining OBV during price rallies suggests the move may lack conviction and could reverse.
Spotting Divergences with Price Action
Bullish divergence occurs when price makes lower lows but OBV makes higher lows, suggesting hidden buying. Bearish divergence shows price higher highs against OBV lower highs, warning of weakening demand. Monitor these patterns on weekly charts for higher accuracy in 2026 trends.
Real examples include instances where major indices formed bullish divergences before strong recoveries, allowing prepared traders to enter positions ahead of the crowd. Practice identifying these on historical charts to build pattern recognition skills.
Combining OBV with Volume Spikes
Pair OBV with sudden volume increases for stronger signals. A volume spike accompanied by OBV breaking above a resistance level often marks the start of a sustained uptrend. Use this combination on stocks within major indices to filter out noise and focus on high-probability setups.
Volume spikes add conviction because they represent unusual participation, often from large players. When aligned with OBV direction changes, these events provide clear entry or exit points supported by multiple data points.
Real-World Examples from Major Indices
Consider historical patterns on the S&P 500 where OBV confirmed the 2024-2025 rally through consistent higher highs. Similar setups appear in Nasdaq tech stocks during accumulation phases. Apply these lessons to current 2026 data by backtesting on platforms like Investopedia resources.
Another case study involves the Dow Jones Industrial Average during periods of sector rotation. OBV helped distinguish between genuine index strength and narrow leadership by tracking cumulative volume across components. Traders who combined OBV with sector-specific volume data avoided false breakouts in 2025 and positioned for broader participation in subsequent moves.
Step-by-Step Setup Instructions
- Open your charting software and load a daily or weekly chart of your target stock or index.
- Add the OBV indicator and adjust the volume source if needed to ensure it matches official exchange data.
- Draw trendlines on both price and OBV to identify breaks and potential support or resistance levels.
- Scan for divergences weekly and confirm with volume spikes for higher probability trades.
- Backtest signals over at least 6-12 months of data before live trading, documenting win rates and risk-reward ratios.
- Incorporate risk management by setting stop losses below recent OBV support levels or key price zones.
Advanced Techniques and Comparisons with Other Indicators
OBV works well alongside tools like the Relative Strength Index or moving average convergence divergence for layered confirmation. Unlike momentum oscillators, OBV focuses purely on volume flow, making it complementary rather than redundant. Traders often overlay OBV on candlestick charts to time entries during pullbacks within established trends.
One advanced approach involves multi-timeframe analysis: use weekly OBV for overall direction and daily OBV for precise timing. This method reduces false signals common in choppy markets.
Common Pitfalls and FAQ
How reliable is OBV in low-volume stocks? Less reliable; focus on high-liquidity names in major indices to avoid erratic readings caused by thin trading.
Should OBV be used alone? No, always combine with price action and other indicators for confirmation to improve overall accuracy.
What timeframes work best? Daily and weekly charts provide the clearest signals for trend analysis, while intraday use requires careful volume filtering.
Can OBV predict exact reversal points? It highlights potential shifts through divergences but works best as a confirmation tool rather than a standalone predictor.
How does OBV perform in sideways markets? It tends to flatten, signaling indecision; wait for a clear break in both price and OBV before acting.
Additional guidance is available through authoritative sources such as MarketWatch and NYSE.
Conclusion
Integrating OBV into your 2026 analysis toolkit allows for earlier detection of trend strength and potential reversals. Practice these techniques consistently to build confidence in volume-confirmed strategies and improve your edge in identifying sustainable market trends.
No comments yet. Be the first!