 Bullish Portfolio
Introduction to Sector Rotation in 2026 Markets
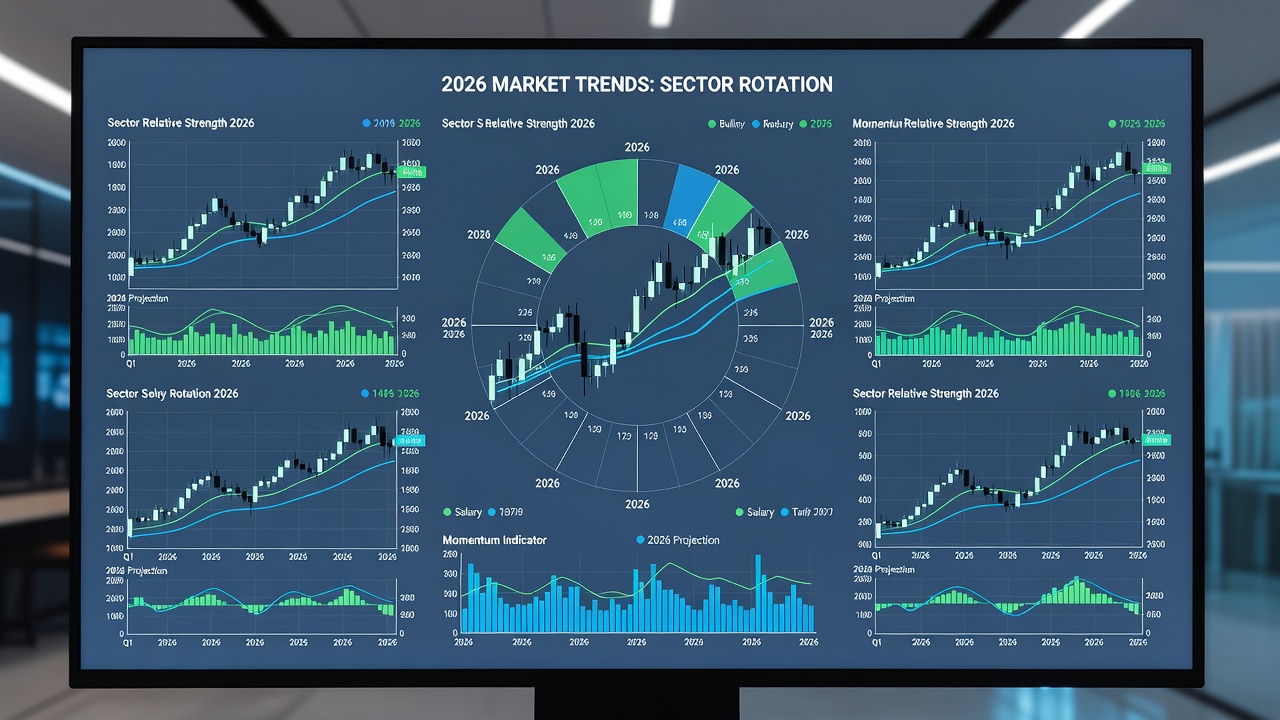
Sector rotation strategies enable investors to shift capital between market sectors as economic conditions evolve. In 2026, technical analysis offers powerful tools to identify these shifts beyond single-stock focus. This method emphasizes relative strength comparisons, volume analysis, and momentum indicators across broad sectors including technology, healthcare, energy, financials, industrials, and consumer staples. By monitoring how capital flows between defensive and cyclical areas, traders can position ahead of macroeconomic changes rather than reacting after the fact.
Understanding rotations improves timing and risk-adjusted returns for both beginners and intermediate investors. The approach moves beyond isolated stock analysis to reveal broader market dynamics driven by interest rates, inflation data, and corporate earnings cycles. Throughout 2026, investors who master these signals gain an edge in volatile environments where traditional buy-and-hold strategies may underperform.
Core Technical Analysis Tools for Sector Rotation
Relative strength analysis compares sector performance against benchmarks such as the S&P 500. Traders calculate ratios of sector ETFs to the index and watch for breakouts above or below key moving averages. This reveals which sectors are leading or lagging the broader market. Volume shifts provide confirmation of institutional participation. Rising volume in defensive sectors like utilities often signals early rotation away from cyclicals during periods of uncertainty. Momentum oscillators such as RSI and MACD applied to sector indices highlight overbought or oversold conditions that frequently precede meaningful rotations.
Additional tools include Bollinger Bands for volatility contraction signals and on-balance volume to detect accumulation or distribution patterns. Combining these indicators creates a robust framework. For instance, a sector showing rising relative strength alongside increasing volume and an RSI crossover above 50 typically offers higher-probability entry opportunities.
Step-by-Step Process for Mapping Rotation Cycles
- Identify the current economic phase using leading indicators from the Federal Reserve.
- Plot sector ETF price charts with 50-day and 200-day moving averages to establish trend context.
- Calculate relative strength ratios and scan for crossovers or divergences against the benchmark.
- Confirm signals with volume spikes, momentum divergences, and support or resistance breaks.
- Enter positions gradually while setting stop-loss levels below recent swing lows and monitoring position sizing rules.
- Review weekly and monthly timeframes to avoid noise from short-term fluctuations.
This structured process reduces emotional decision-making and helps investors stay aligned with prevailing market regimes.
Real-World 2026 Examples from Major Indices
During early 2026, technology and consumer discretionary sectors displayed strong momentum on Nasdaq Composite charts while utilities and consumer staples lagged. Volume surges in semiconductor ETFs preceded a broader rotation into value sectors as interest rate expectations stabilized. Investors monitoring RSI readings on the S&P 500 sector SPDRs captured gains by shifting into financials ahead of earnings season. Later in the year, energy sectors showed relative strength during geopolitical tensions, confirmed by MACD bullish crossovers and rising on-balance volume.
These examples highlight the importance of multi-timeframe analysis. Weekly charts provided macro direction while daily charts refined precise entry points. Market participants who waited for confluence across relative strength, volume, and momentum avoided false signals that trapped less disciplined traders.
Defensive vs Cyclical Sectors Comparison
| Sector Type | Examples | Typical Rotation Timing | Key Technical Signals |
|---|---|---|---|
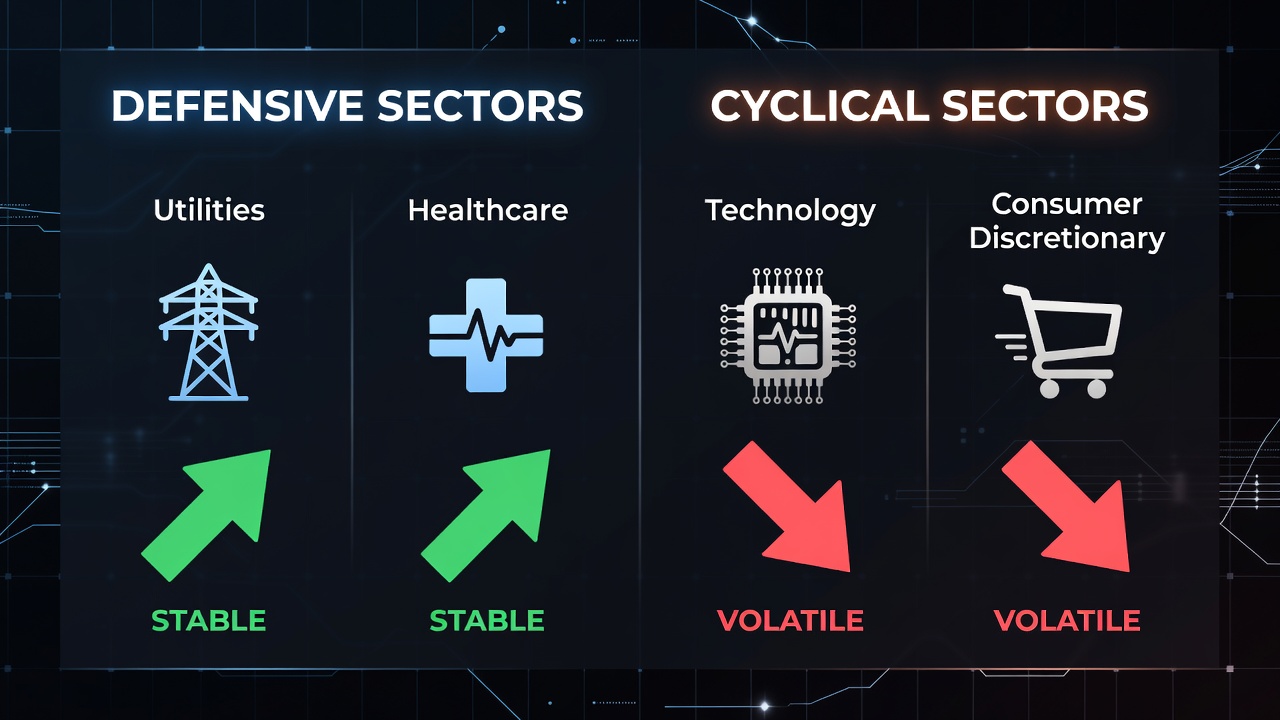
| Defensive | Utilities, Healthcare, Consumer Staples | Early recession signals or rising volatility | RSI below 40, rising relative strength ratio, volume increase |
| Cyclical | Technology, Industrials, Consumer Discretionary, Energy | Expansion phase confirmation or improving economic data | Price above 200-day MA, MACD bullish crossover, relative strength breakout |
Understanding these distinctions allows investors to anticipate shifts rather than chase them. Defensive sectors tend to outperform during uncertainty while cyclical sectors lead during growth phases.
Risk Management Tips and Common Pitfalls
Effective risk management begins with diversification across at least three sectors during transitions. Position sizing rules should limit any single sector to no more than 25 percent of total portfolio exposure. Traders benefit from using trailing stops based on average true range to account for changing volatility. Regular review of economic releases from sources such as the Bureau of Labor Statistics helps anticipate policy-driven rotations.
Common pitfalls include ignoring volume confirmation, which often leads to false breakouts. Another frequent mistake is failing to adjust stops as volatility expands. Over-reliance on a single timeframe produces whipsaw trades during choppy markets. Many beginners also neglect transaction costs and tax implications when executing frequent rotations. Avoiding these errors requires discipline and consistent application of the step-by-step mapping process.
Practical Implementation for Beginners and Intermediate Traders
Start by selecting a core set of sector ETFs that track major indices. Paper trade the full process for several months to build familiarity with indicator behavior. Once comfortable, allocate small position sizes and gradually increase exposure. Integrate fundamental context such as earnings growth trends and central bank communications to filter technical signals. Platforms offering real-time sector heat maps and ratio charts accelerate analysis efficiency.
Advanced practitioners often layer intermarket analysis, examining relationships between equities, bonds, and commodities to refine rotation timing. This layered approach adds depth to purely technical readings.
Conclusion
Sector rotation powered by technical analysis equips investors to navigate 2026 trends effectively. By mastering relative strength, volume analysis, and disciplined risk rules, market participants can improve outcomes across varying economic environments. Continuous practice with live charts builds the intuition needed for consistent execution.
FAQ
How do I time entries during sector rotations?
Wait for relative strength ratio breakouts combined with volume confirmation and favorable momentum readings before committing capital. Multiple timeframe alignment further improves accuracy.
What are the best tools for tracking sector momentum?
Sector SPDR ETFs paired with RSI, MACD, and moving average overlays on platforms like TradingView deliver reliable signals. Supplement with economic calendars from the U.S. Securities and Exchange Commission for context.
Can beginners apply these strategies successfully?
Yes, starting with paper trading and focusing on the step-by-step mapping process builds confidence before using real capital. Focus first on one or two sectors to avoid overwhelm.
How often should I review sector rotation signals?
Daily scans suffice for most intermediate traders, while weekly reviews capture the primary cycle direction. Adjust frequency based on personal time availability and market volatility.
What role does macroeconomic data play in technical sector analysis?
Macro data provides the fundamental backdrop that validates or invalidates technical signals. Combining both dimensions reduces false positives during uncertain periods.
No comments yet. Be the first!