 Bullish Portfolio
Introduction to Market Cycles in 2026
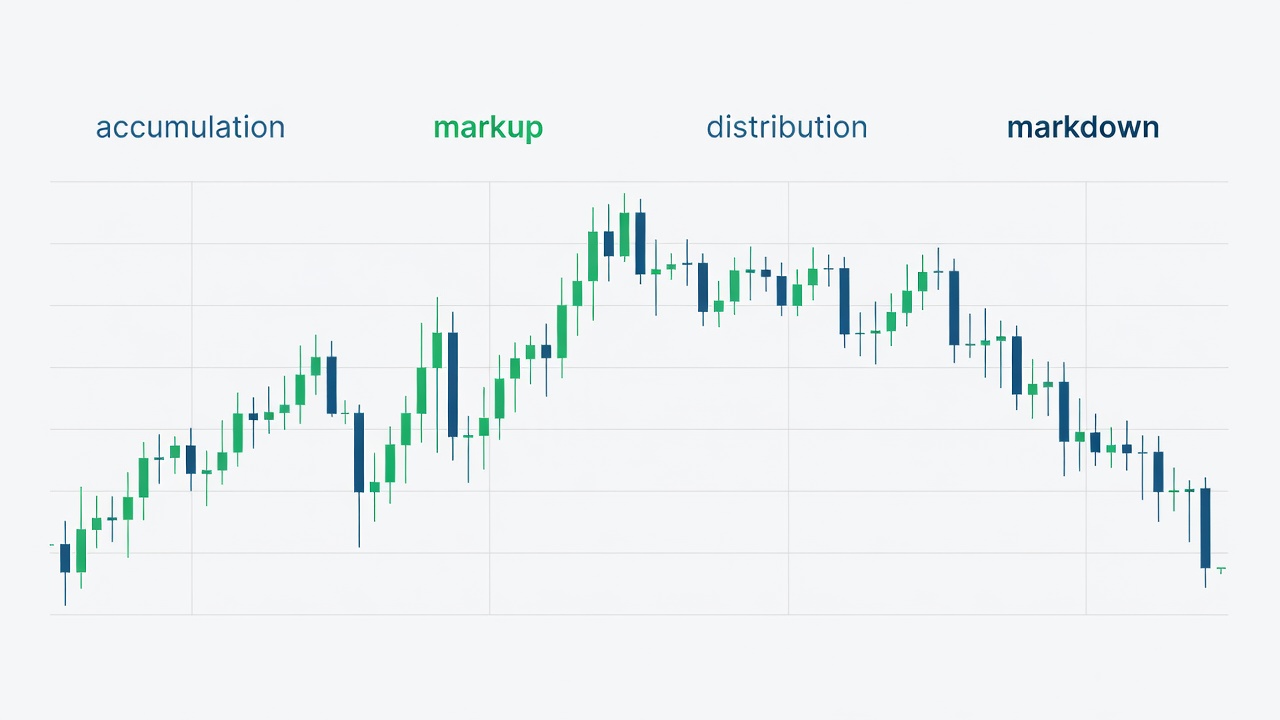
Market cycles represent the natural rhythm of financial markets, driven by investor psychology, economic factors, and external events. In 2026, traders using technical analysis can better navigate volatility by recognizing these repeating patterns. This guide provides a complete framework for identifying the four primary phases—accumulation, markup, distribution, and markdown—along with actionable indicators and strategies. Understanding cycles helps investors time entries and exits more effectively while managing downside risk. Whether you are new to technical analysis or refining your approach, these methods integrate price action, volume, and momentum tools to improve decision-making across equities, forex, and crypto markets.
Technical analysis of cycles draws on decades of observed behavior where markets move in predictable waves rather than straight lines. By studying historical data and applying current tools, traders can anticipate shifts before they become obvious to the broader public. This depth of insight proves especially valuable in 2026 amid rapid technological changes and evolving liquidity conditions.
The Four Main Phases of Market Cycles
Every market cycle progresses through four distinct stages. Recognizing the characteristics of each phase allows traders to adjust their strategies accordingly and avoid common pitfalls such as buying at tops or selling at bottoms.
Accumulation Phase
This phase occurs after a prolonged downtrend when smart money begins quietly buying assets at lower prices. Prices often move sideways within a defined range as supply and demand reach equilibrium. Volume typically remains low but starts to show subtle increases on up days. Key technical signals include a flattening moving average convergence divergence (MACD) histogram and relative strength index (RSI) readings between 40 and 60. Support levels hold firmly while resistance gradually weakens. Traders often observe decreasing volatility measured by Bollinger Band width contracting over several weeks.
Practical example: In early 2026 equity markets, certain technology stocks exhibited tight consolidation ranges after the prior year’s correction, with institutional footprints visible through block trades reported on exchange data. Beginners should focus on daily and weekly charts to filter noise.
Markup Phase
Once accumulation completes, the markup phase begins with a decisive breakout above resistance. This bullish stage features higher highs and higher lows, driven by increasing participation from retail investors. Momentum indicators such as the stochastic oscillator often remain in overbought territory for extended periods. Traders look for pullbacks to the 20-period or 50-period exponential moving average as entry opportunities. Volume confirmation on breakout days strengthens the validity of the move. Additional confirmation comes from rising on-balance volume (OBV) and positive MACD histogram expansion.
Realistic application involves scaling into positions gradually rather than committing full capital at the breakout. This approach reduces regret if the move pauses for retesting.
Distribution Phase
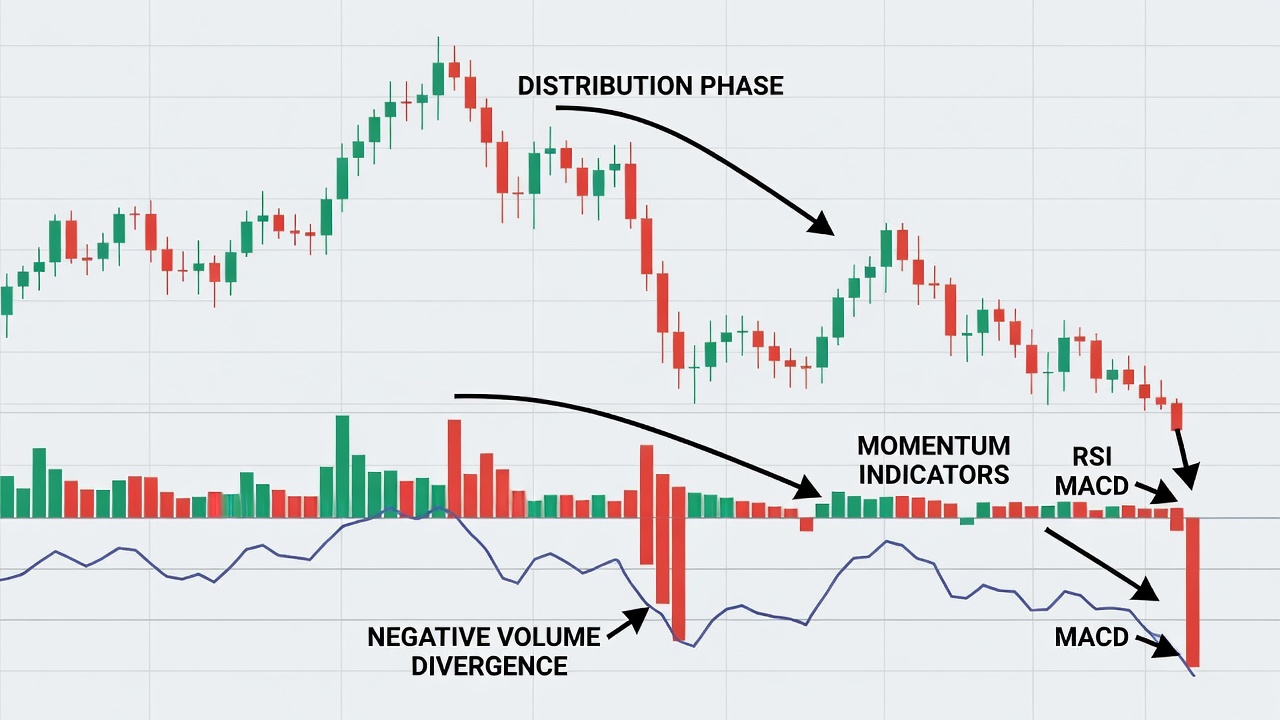
Distribution marks the transition from bullish to bearish sentiment. Large institutions sell positions into strength while retail traders continue buying. Prices may reach new highs, but these advances occur on declining volume, creating negative divergence. Watch for bearish candlestick patterns such as shooting stars or evening stars near resistance. The average directional index (ADX) often peaks and begins to decline, signaling weakening trend strength. Another reliable clue appears when the commodity channel index (CCI) fails to make new highs alongside price.
Case study consideration: During mid-2026, several broad market indices displayed classic distribution characteristics with shrinking volume spikes on successive rally attempts, prompting cautious professionals to reduce exposure ahead of broader weakness.
Markdown Phase
The final markdown phase brings sharp declines as fear dominates. Support levels break decisively, and prices accelerate lower with expanding volume. Momentum tools like the commodity channel index (CCI) drop deeply into oversold territory. Short-selling strategies and protective stops below recent swing lows become appropriate during this stage. Traders also monitor for capitulation spikes where volume reaches extremes and RSI falls below 30 for multiple sessions.
Step-by-Step Methods to Spot Cycle Transitions
- Monitor price action relative to key moving averages (50-day and 200-day) to identify when trends shift from sideways to directional.
- Track volume trends using on-balance volume (OBV) to confirm institutional activity and detect divergences early.
- Observe momentum divergences between price and RSI or MACD on multiple timeframes for higher conviction signals.
- Identify chart patterns such as rectangles for accumulation or head-and-shoulders for distribution, validating them with volume.
- Wait for a confirmed breakout or breakdown before shifting bias, and always check higher-timeframe alignment.
- Review economic calendars from sources like the Federal Reserve to anticipate catalysts that may accelerate phase changes.
Integrating Volume and Momentum Tools
Volume serves as the fuel behind price moves. Rising volume during markup validates strength, while falling volume during distribution warns of exhaustion. Combine volume profile analysis with momentum oscillators to filter false signals. For example, a bullish MACD crossover accompanied by above-average volume carries higher probability than the same crossover on low volume. In 2026 markets, algorithmic trading can distort short-term volume, so focus on weekly and daily timeframes for clearer cycle context. Advanced users layer in tools such as the Chaikin Money Flow indicator to quantify buying and selling pressure more precisely.
Additional depth comes from comparing relative volume against 20-day averages. Spikes exceeding 150 percent of average often mark important inflection points within any phase.
Risk Management Rules During Volatile Periods
Volatile cycle transitions demand strict risk controls. Always define maximum loss per trade at 1-2% of portfolio capital. Use trailing stops based on average true range (ATR) to protect profits during markup while allowing room for normal fluctuations. Avoid over-leveraging in distribution phases where whipsaws increase. Maintain a trading journal to review cycle-based decisions and refine rules over time. Position sizing should shrink during periods of elevated volatility measured by the VIX or equivalent metrics. Diversification across uncorrelated assets further buffers against unexpected cycle extensions.
Comparison of Cycle-Based Strategies
| Strategy | Best Phase | Key Indicators | Risk Level | Typical Holding Period |
|---|---|---|---|---|
| Range Trading | Accumulation | RSI, Bollinger Bands | Low | Days to weeks |
| Trend Following | Markup | Moving Averages, MACD | Medium | Weeks to months |
| Reversal Trading | Distribution | Volume Divergence, ADX | High | Days to weeks |
| Short Selling | Markdown | CCI, Support Breaks | High | Days to weeks |
Common Mistakes to Avoid
Many traders misidentify phases by relying on single indicators without confirmation. Another frequent error involves ignoring higher-timeframe context, leading to trades against the dominant cycle. Overtrading during low-volume periods and neglecting stop-loss discipline also erode returns. To mitigate these issues, develop a checklist that requires at least three confirming signals before acting.
Real-World Application in 2026 Markets
Applying these concepts to 2026 conditions requires awareness of macroeconomic catalysts such as interest rate decisions and geopolitical developments. Historical patterns show that cycles often compress or extend based on liquidity conditions. Traders who combine cycle analysis with broader economic calendars achieve more consistent results. Regulatory updates from the U.S. Securities and Exchange Commission can also influence sentiment and volume patterns, making it wise to monitor official announcements.
Frequently Asked Questions
How do I time entries during the accumulation phase?
Wait for a breakout above the accumulation range high with volume confirmation. Place stops just below the range low and consider scaling in over multiple sessions.
What indicators work best for spotting distribution?
Look for RSI bearish divergence combined with declining OBV and rising volatility. Candlestick reversal patterns near resistance add further confirmation.
Can cycle analysis be used across different asset classes?
Yes. The same four-phase framework applies to equities, commodities, and cryptocurrencies with minor adjustments to timeframe and volume interpretation.
How should beginners start implementing these techniques?
Begin with daily charts of major indices, practice identifying phases on historical data, then apply rules on a paper trading account before risking capital.
What role does news flow play in cycle transitions?
News often acts as the catalyst that ends accumulation or accelerates markdown. Always cross-reference fundamental events with technical signals for best results.
Conclusion
Mastering market cycles through technical analysis equips traders with a structured approach to 2026 trends. By focusing on phase-specific signals, volume confirmation, and disciplined risk management, investors can improve timing and protect capital across varying market conditions. Continuous practice, journaling, and adaptation to new market regimes remain essential for long-term success in dynamic environments.
No comments yet. Be the first!