 Bullish Portfolio
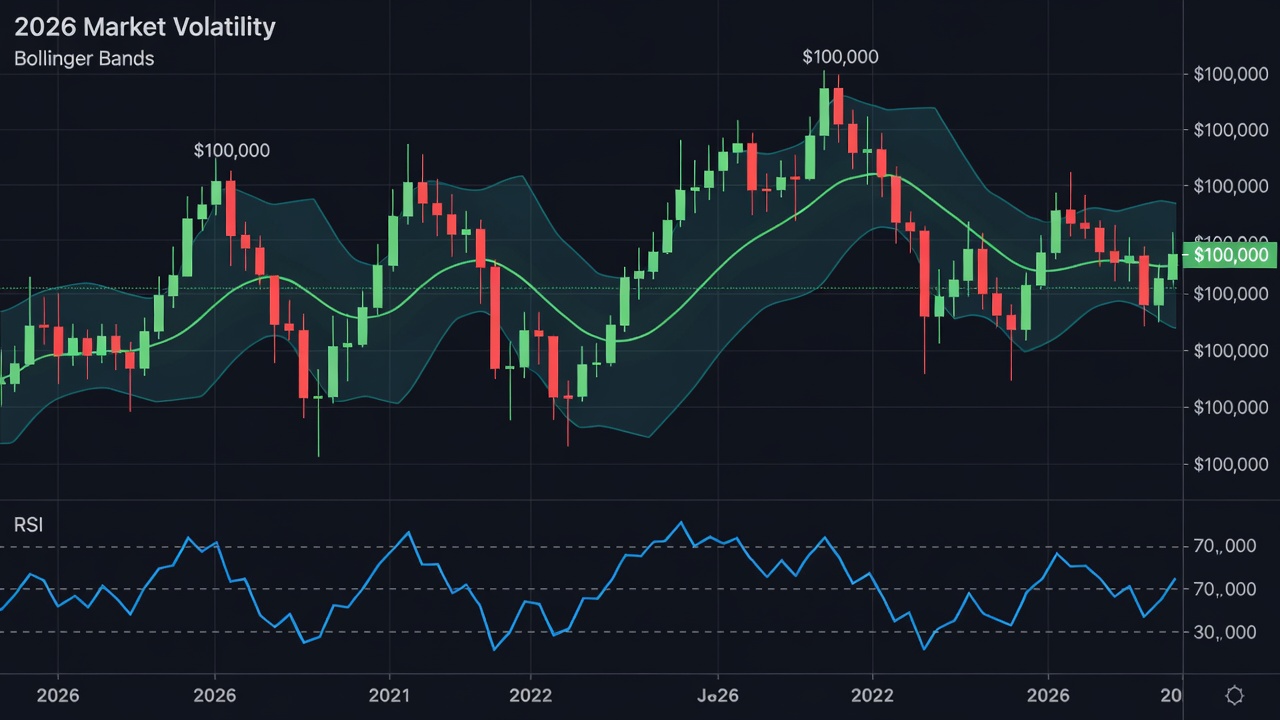
Introduction to Navigating 2026 Market Volatility
Market volatility in 2026 is projected to intensify due to evolving macroeconomic factors, geopolitical tensions, and rapid technological shifts in trading algorithms. Swing traders who master technical analysis can capitalize on these swings by focusing on trend strength and momentum shifts rather than attempting to predict every short-term fluctuation. This comprehensive guide provides in-depth strategies for identifying opportunities, selecting the right indicators, and implementing disciplined risk management. By integrating market trend data with proven tools, traders can build a repeatable workflow that adapts to changing conditions while avoiding common errors that erode profits during turbulent periods.
Understanding the Drivers of 2026 Volatility
Volatility arises from a combination of economic data releases, central bank policy decisions, and sector-specific news. In 2026, analysts anticipate heightened swings in equity markets as inflation dynamics and supply chain adjustments continue to influence investor sentiment. Technical analysis excels here because it focuses on price action and volume rather than fundamentals alone. Traders should monitor broader indices like the S&P 500 for regime changes, using historical volatility patterns as a baseline. Recognizing whether the market is in a trending or mean-reverting state allows for better alignment of swing strategies with prevailing conditions, reducing the likelihood of fighting the tape during strong directional moves.
Selecting Indicators for Volatile Conditions
Standard tools often underperform in high-volatility settings, so prioritize those that adapt to expanding price ranges. The Average True Range (ATR) quantifies daily volatility and helps set dynamic stops, while Bollinger Bands reveal periods of contraction that often precede explosive moves. Momentum oscillators such as the Relative Strength Index (RSI) and MACD provide early warnings of exhaustion or acceleration. For example, an RSI divergence on a daily chart during a volatility spike can signal an impending reversal even when price makes new highs. Combine these with volume-weighted indicators to confirm institutional participation. Avoid over-optimization; instead, backtest combinations on recent volatile periods to ensure robustness across different market regimes.
Spotting Breakout Setups in Volatile Markets
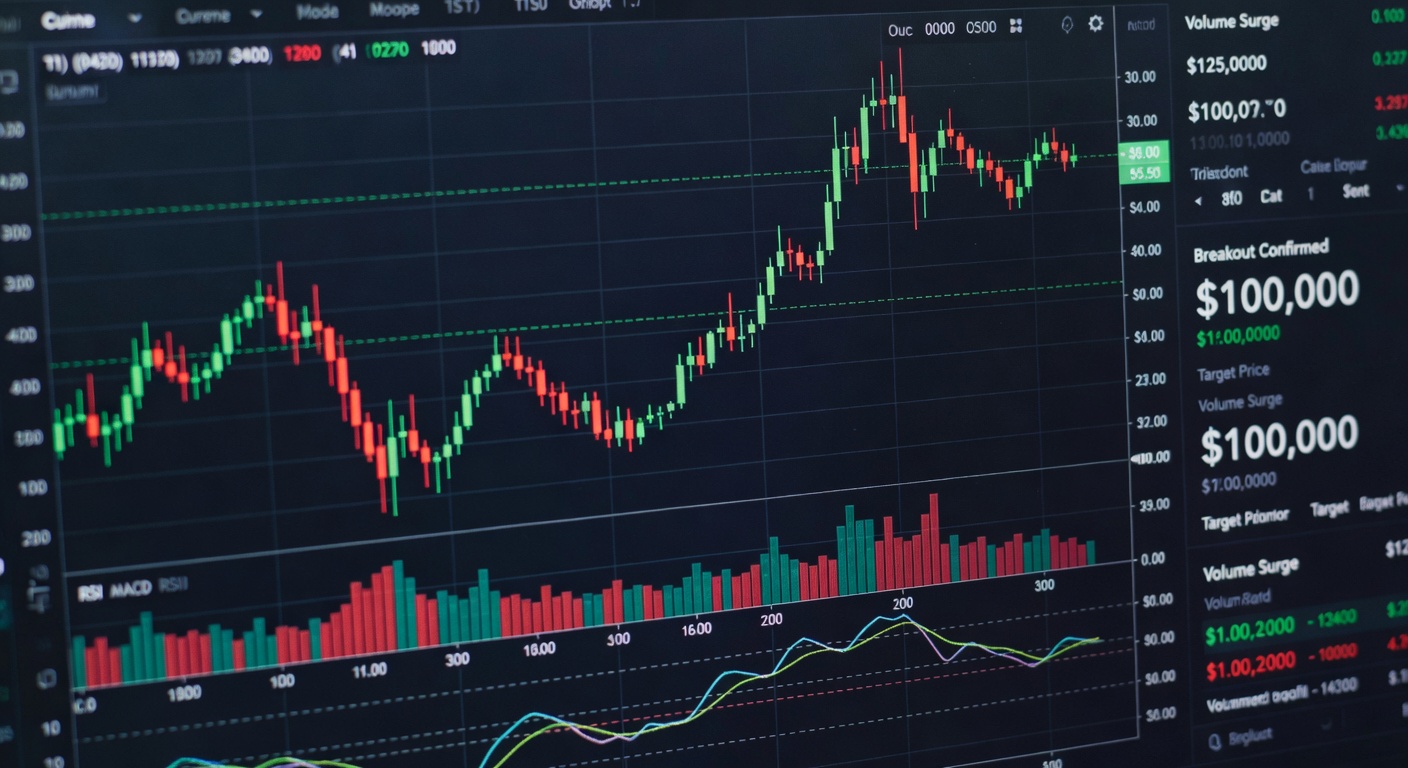
Breakouts represent high-reward opportunities when price escapes consolidation ranges with conviction. In 2026 volatility, focus on setups where price closes decisively beyond a key resistance or support level accompanied by at least double the average volume. Candlestick patterns like engulfing bars or inside-bar breakouts add confluence. Always check multiple timeframes: a daily breakout gains credibility if the weekly chart shows alignment with the broader trend. False breakouts are frequent during news events, so wait for a retest of the broken level as new support or resistance before entering. This filter dramatically improves win rates by ensuring the move has follow-through momentum rather than a temporary liquidity grab.
Implementing Position Sizing Rules
Position sizing is the cornerstone of survival in volatile markets. Determine risk per trade as a small percentage of total capital, typically 1% or less, then calculate share size using the distance from entry to stop-loss multiplied by ATR. For instance, if ATR indicates a 3% expected move and you risk 1% of a $100,000 account, the position size adjusts automatically to keep losses capped. Scale into winners only after the trade moves in your favor by at least one ATR, and use trailing stops based on volatility bands to lock in gains during extended swings. This systematic approach prevents emotional decisions and maintains consistent risk exposure whether the market is calm or chaotic.
Step-by-Step Workflow for Building Swing Trades
- Begin with a daily scan using volatility filters to isolate assets with ATR readings in the upper quartile of their 50-day range.
- Analyze the higher timeframe (weekly) to determine overall trend direction and avoid counter-trend swings.
- Drill down to the 4-hour chart to pinpoint precise entry zones near recent swing points or breakout levels.
- Apply momentum confirmation via RSI or MACD histogram to ensure the move has fuel behind it.
- Define risk parameters including stop-loss placement below the recent low or using an ATR multiple, and set profit targets at measured move projections or prior resistance.
- Execute the trade with limit orders during regular session hours and monitor for volume spikes that could indicate reversal.
- Review the position daily, adjusting stops only when predefined technical conditions are met.
Comparing Different Volatility Regimes with Chart Examples
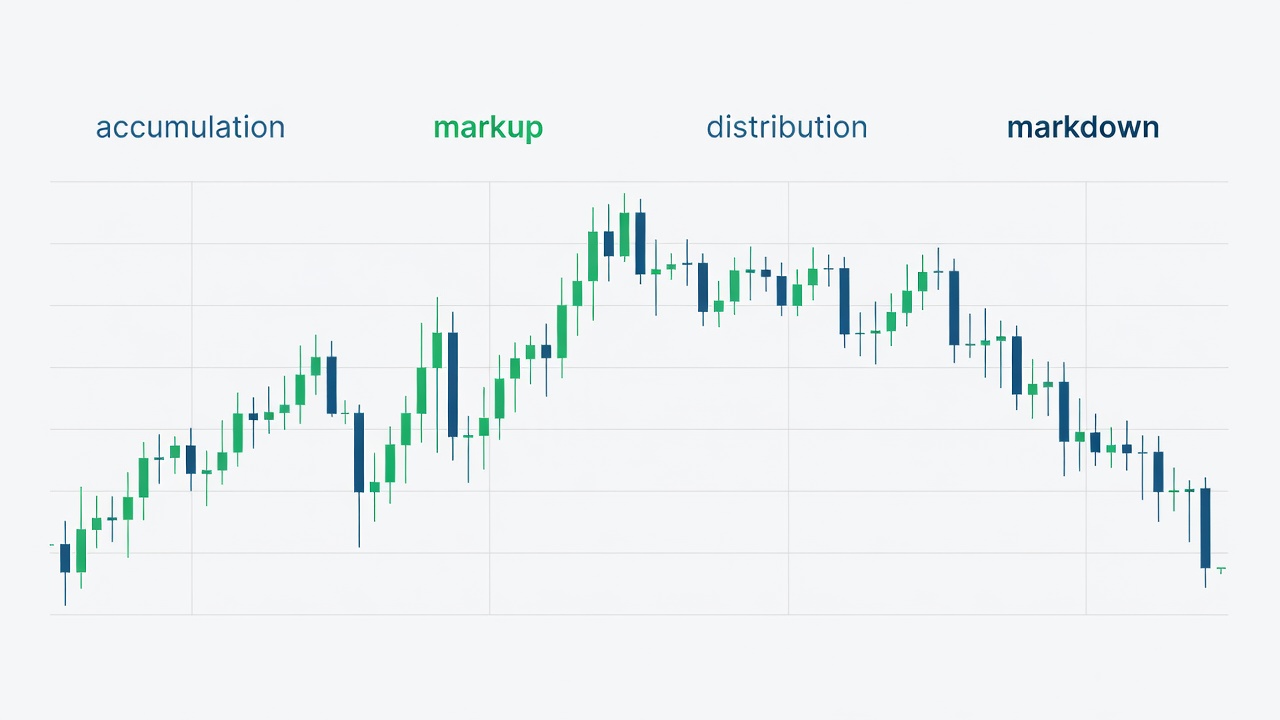
Low-volatility regimes feature tight Bollinger Band squeezes and range-bound price action, favoring mean-reversion tactics over pure breakouts. In contrast, high-volatility regimes show wide ranges, frequent gaps, and rapid momentum shifts that reward trend-following swing entries. Consider a hypothetical 2026 example where a technology stock experiences a volatility expansion: price breaks above a multi-week consolidation on surging volume, RSI climbs above 60, and ATR doubles its prior average. Traders entering on the breakout with an ATR-based stop would capture the subsequent leg higher, whereas the same setup in a low-volatility environment might fail due to lack of follow-through. Comparing these regimes side-by-side on historical charts reveals that indicator thresholds must be adjusted dynamically to maintain edge.
Common Pitfalls and FAQ
One frequent mistake is chasing breakouts without volume confirmation, leading to quick reversals during high-volume news periods. Another is ignoring position sizing during emotional market moves, which amplifies losses. Always maintain a trading journal to review false signals and refine rules over time. Federal Reserve resources offer valuable macroeconomic context that complements technical signals.
Frequently Asked Questions
How do I avoid false breakouts in 2026? Require both volume expansion and a close beyond the level, then wait for a successful retest before committing capital.
Which timeframes are optimal for swing trading volatile markets? Daily charts provide reliable signals while 4-hour charts refine entries; avoid lower timeframes that amplify noise.
Should fundamentals be ignored entirely? No, but use them only as a secondary filter. Technical triggers remain primary. SEC investor guidance highlights disclosure events that often drive volatility spikes.
What is the best way to handle overnight gaps? Size positions conservatively and use stop orders that account for typical gap ranges observed in similar volatility conditions.
No comments yet. Be the first!