 Bullish Portfolio
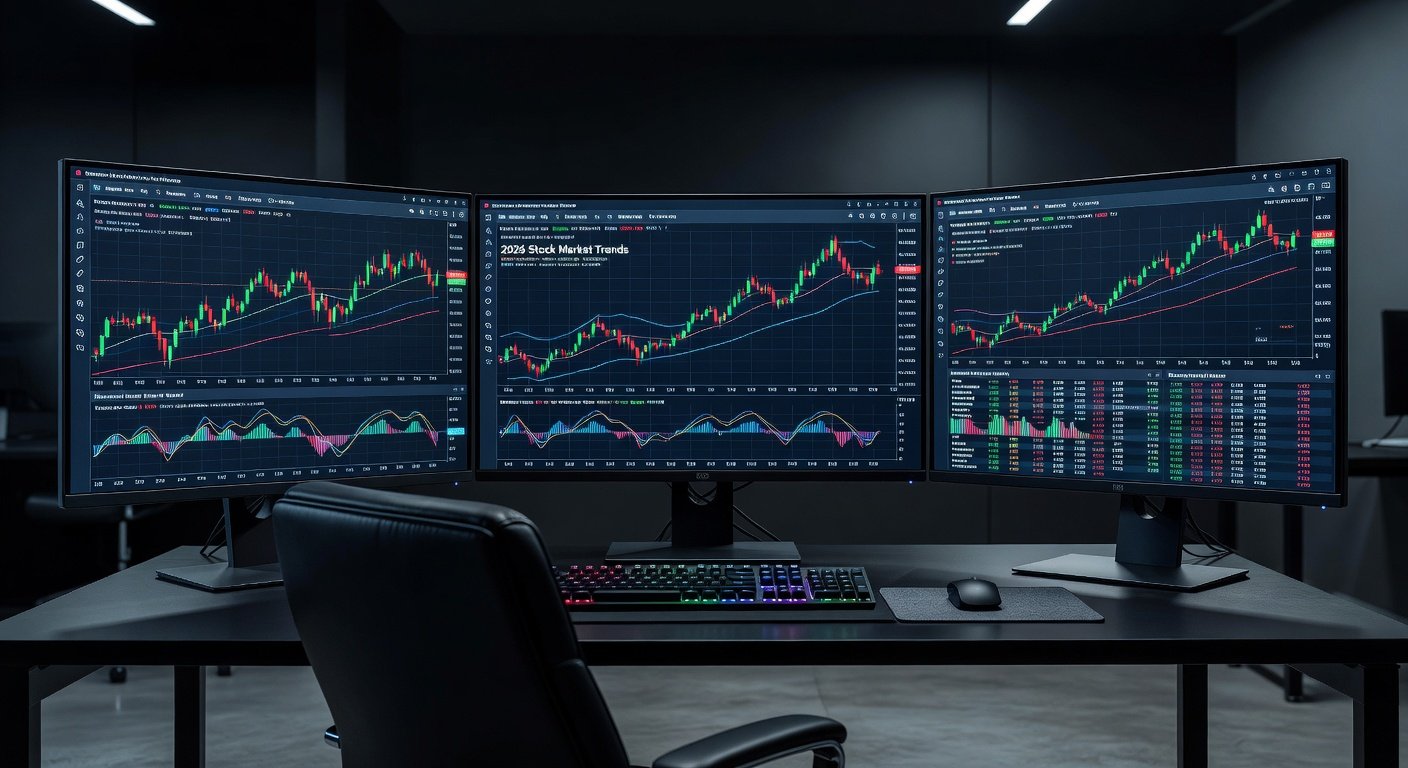
Introduction to Custom TA Dashboards in 2026
As markets evolve with heightened volatility patterns in 2026, experienced analysts need tools that go beyond standard charting software. Building a custom technical analysis (TA) dashboard allows traders to track multiple asset classes efficiently while incorporating advanced indicators tailored to current conditions. This approach supports faster decision-making by aggregating price action, volume data, and momentum signals into a single interface. Traders who customize their setups can adapt quickly to shifting economic indicators, geopolitical events, and sector rotations that define the 2026 landscape. The result is improved workflow efficiency and reduced reliance on fragmented tools.
Custom dashboards also enable the integration of proprietary calculations that reflect personal trading styles. Whether focusing on intraday swings or longer-term position management, these tools provide a competitive edge by surfacing relevant data without manual cross-referencing across multiple platforms.
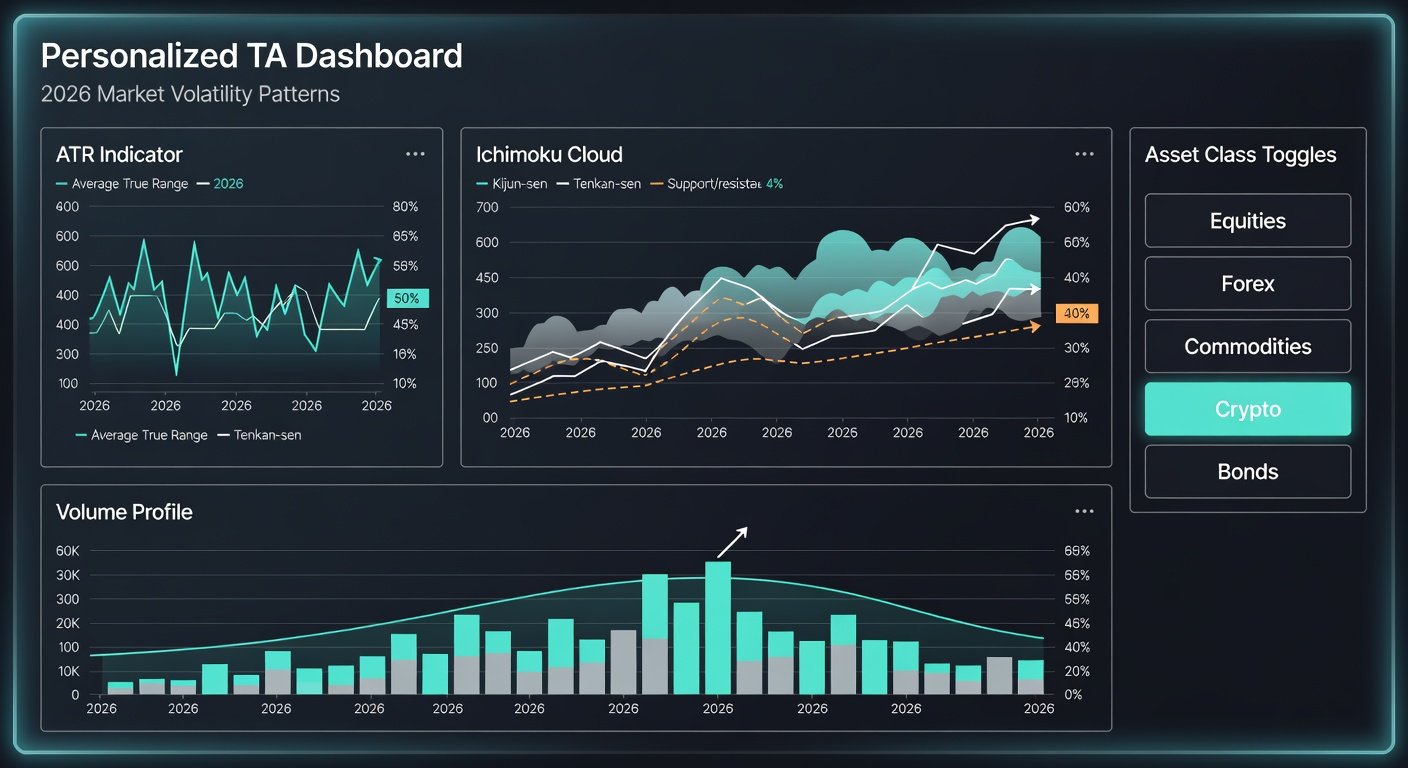
Selecting Core Indicators Beyond Basic Tools
Standard moving averages and RSI are insufficient for 2026's dynamic environment. Focus on indicators like the Average True Range (ATR) for volatility measurement, Ichimoku Cloud for trend confirmation, and custom Fibonacci extensions adapted to recent swings. Combine these with volume profile analysis to identify key support and resistance levels in real time. Additional layers such as the McClellan Oscillator for breadth and the Put-Call Ratio for sentiment add depth when monitoring broad market participation.
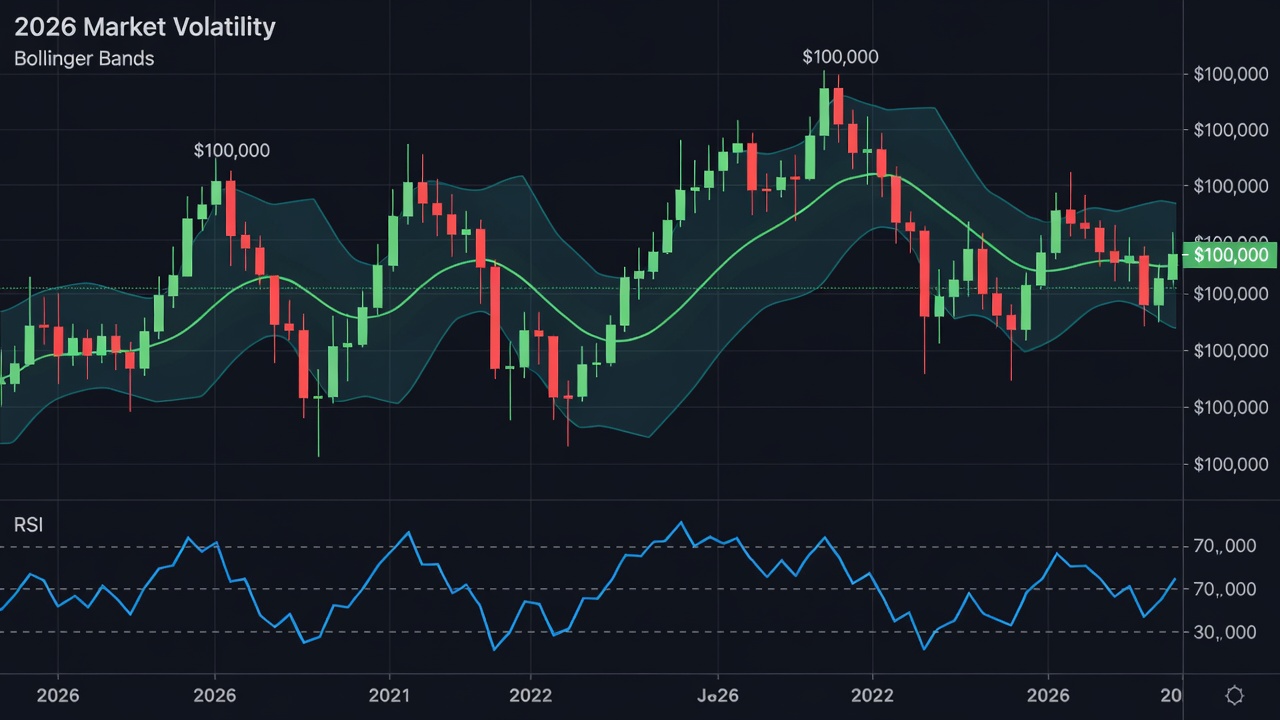
Practical Example: Volatility Tracking
Consider a dashboard monitoring the S&P 500 during periods of elevated uncertainty. Overlay ATR with Bollinger Bands set to 2.5 standard deviations to capture outlier moves. This setup helps analysts spot potential breakouts early while filtering noise from false signals. In one scenario, a trader might notice ATR expansion coinciding with a cloud twist in Ichimoku, signaling a high-probability reversal in tech stocks amid earnings season.
Advanced Indicator Combinations
Pairing the Relative Strength Index with custom divergence detectors can highlight weakening momentum before price reversals occur. For commodities, incorporating the Commitment of Traders report data as an overlay provides institutional flow context that basic retail platforms often omit. These combinations require careful calibration to avoid indicator overload, which can clutter the visual workspace.
Integrating Real-Time Data Feeds
Connect your dashboard to reliable APIs from providers such as Bloomberg or Alpha Vantage. Ensure low-latency feeds for equities, futures, and forex. Test integration using WebSocket protocols to stream live price updates without delays. Authentication steps typically involve generating API keys and configuring rate limits to prevent throttling during peak market hours.
For robust setups, refer to official documentation on data handling from Investopedia. Real-time feeds must also handle corporate actions like dividends and splits automatically to maintain accuracy across historical comparisons.
Handling Multiple Asset Classes in Feeds
When pulling data for bonds alongside equities, normalize timestamps across exchanges to prevent misalignment. Many analysts use middleware scripts in Python to aggregate feeds from different sources into a unified JSON structure before rendering on the dashboard. This prevents discrepancies that arise from varying exchange hours.
Customizing Layouts for Different Asset Classes
Equity dashboards might emphasize candlestick patterns and momentum oscillators, while commodity views prioritize seasonal indicators and commitment of traders reports. Create modular layouts that switch based on the asset class selected. Forex layouts benefit from correlation matrices showing currency pair relationships, whereas crypto sections can incorporate on-chain metrics when relevant.
Responsive design principles ensure the dashboard scales across desktop and tablet views without losing critical chart visibility. Color coding by asset class further reduces cognitive load during fast-moving sessions.
Step-by-Step Setup Guide
- Choose your base platform and install required plugins for indicator libraries and API connectivity.
- Define data sources and authenticate API keys while setting appropriate permissions for read-only access where possible.
- Build indicator scripts using Python or Pine Script, starting with simple ATR calculations before layering more complex logic.
- Design responsive grid layouts for multi-monitor setups, testing responsiveness on different screen resolutions.
- Implement alerts tied to custom thresholds, such as ATR spikes above a 20-day average, and route them to mobile notifications.
- Conduct thorough backtesting on at least two years of historical data to validate signal reliability before live deployment.
Comparison of Popular Platforms
TradingView offers excellent community scripts but limited backend customization for proprietary data sources. Thinkorswim provides deep options analytics suitable for advanced users handling derivatives alongside equities. For fully bespoke solutions, consider open-source frameworks like Grafana integrated with financial libraries such as pandas and TA-Lib. Each platform carries trade-offs in learning curve, cost structure, and extensibility that analysts must weigh against their specific workflow needs.
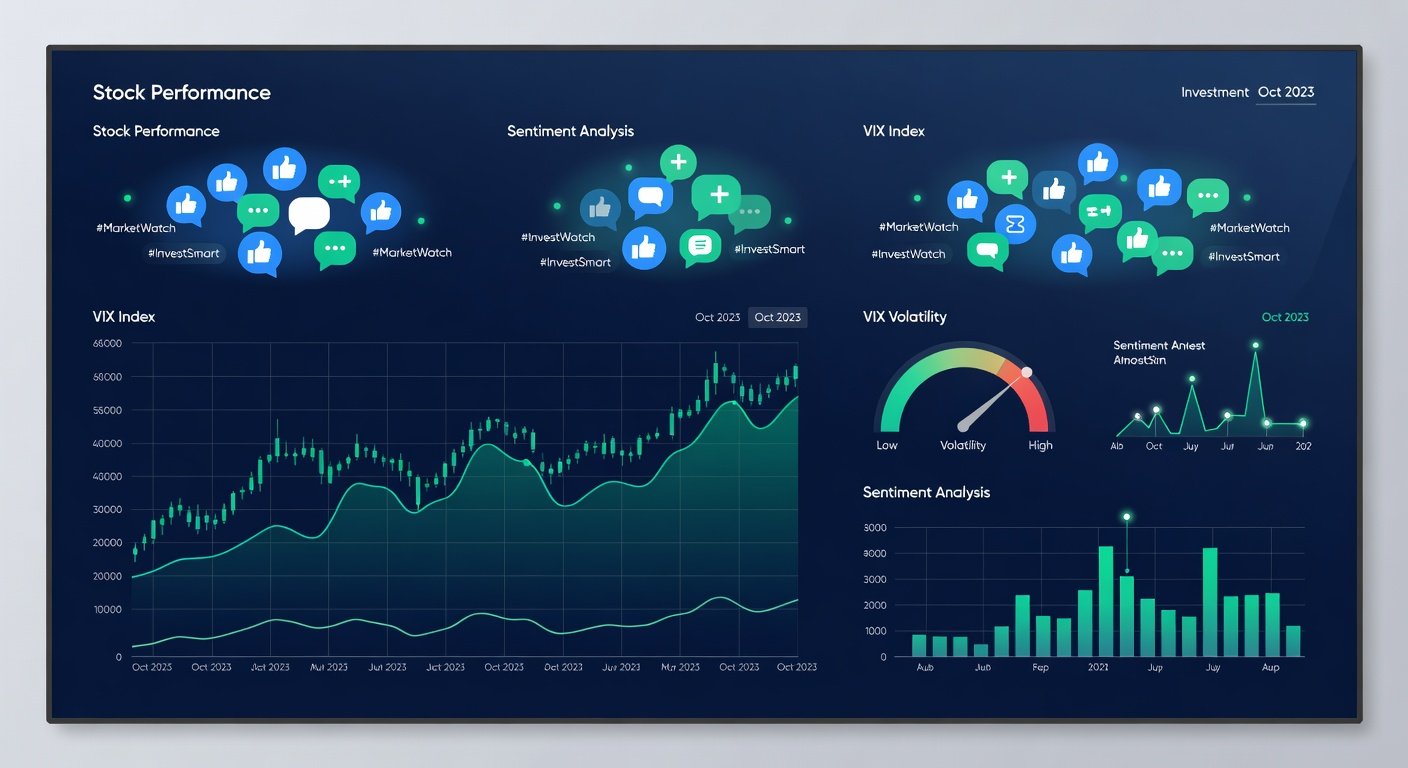
Practical Examples Using 2026 Volatility Patterns
During early 2026 volatility spikes driven by policy announcements, a custom dashboard might display synchronized views of equity indices, VIX futures, and sector ETFs. One analyst example involved configuring heatmaps that highlighted defensive sectors when volatility exceeded historical norms. Another case used automated layout switching to emphasize bond yields during risk-off periods, allowing rapid rotation signals without manual intervention.
Risk Management Tips and Common Pitfalls
Always backtest custom indicators against historical 2026 data subsets. Avoid over-optimization by limiting parameters. Common mistakes include ignoring slippage in live trading and failing to account for overnight gaps. Diversify dashboard views to prevent tunnel vision on single signals. Regularly audit data feed integrity to catch outages early and maintain redundant sources for critical indicators.
Additional regulatory insights are available via SEC.gov. Another useful reference for macroeconomic context is Federal Reserve resources.
FAQ
How do I handle data latency in custom dashboards?
Use dedicated VPS hosting close to exchange servers and prioritize WebSocket over REST APIs for sub-second updates.
What indicators work best for 2026 volatility?
ATR combined with implied volatility surfaces from options chains provides superior context during uncertain periods.
Can beginners build these dashboards?
This guide targets experienced users; novices should start with pre-built templates before advancing to customization.
How often should layouts be reviewed and updated?
Quarterly reviews are recommended to incorporate new market regimes or asset classes that emerge throughout the year.
What backup strategies prevent data loss during feed disruptions?
Maintain local cached datasets and secondary API keys from alternate providers to ensure continuity.
Conclusion
Custom TA dashboards empower analysts to navigate 2026 markets with precision. By focusing on advanced indicators, seamless data integration, and disciplined risk controls, traders can achieve measurable efficiency gains in their analysis routines while adapting to evolving volatility dynamics.
No comments yet. Be the first!