 Bullish Portfolio
Introduction to 2026 Global Market Dynamics
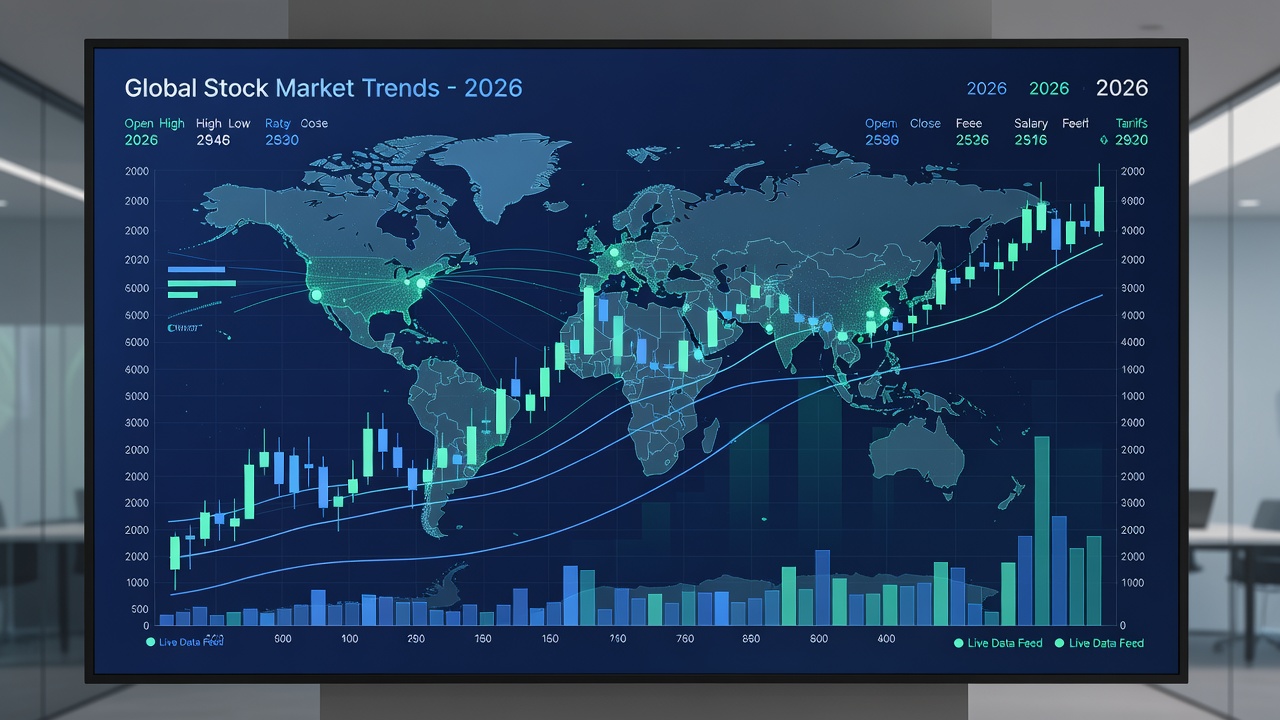
As economic uncertainty persists into 2026, traders are turning to technical analysis to navigate shifting global stock markets. This approach focuses on price action, volume, and indicators rather than fundamentals alone, helping identify emerging trends across borders. Whether monitoring U.S. indices or Asian exchanges, technical tools provide actionable signals when adapted properly. Global factors such as ongoing supply chain disruptions, interest rate divergences, and geopolitical developments continue to create both risks and opportunities that purely domestic strategies often overlook.
Technical analysis excels in volatile environments by highlighting support, resistance, and momentum shifts. In 2026, factors like geopolitical tensions and supply chain realignments create opportunities for those skilled at reading charts internationally. Beginners and intermediate traders alike benefit from understanding how these tools scale beyond single-country focus to capture multi-region movements.
Core Principles of Technical Analysis for Global Markets
Understanding trends begins with recognizing higher highs and higher lows in uptrends or the opposite in downtrends. Key indicators include moving averages for trend direction, RSI for overbought conditions, and MACD for momentum changes. When applied globally, these must account for varying trading hours and liquidity levels across exchanges. Volume confirmation remains critical because a breakout on low volume in one region may signal false moves compared to high-volume surges elsewhere.
Traders should also consider currency fluctuations, as they influence chart patterns on foreign indices. For example, a strengthening U.S. dollar can compress emerging market charts even when local prices appear stable. Combining multiple indicators helps filter noise and improves reliability when scanning across time zones.
Identifying Trends Across Regions
Regional differences require tailored scans. U.S. markets often show strong reactions to Federal Reserve announcements, while Asian markets respond more to export data and regional trade policies. Start by overlaying multiple timeframes to confirm alignment between daily and weekly charts. Federal Reserve resources provide context on policy timing that often drives U.S. price action.
Practical example: A rising channel on the S&P 500 might coincide with consolidation patterns on the Nikkei, signaling potential capital rotation toward Asia. Cross-reference with broader indices like the MSCI World for confirmation. Additional regions such as European and Latin American exchanges add further layers, requiring attention to local economic calendars.
Comparing U.S. Versus Asian Market Behaviors
U.S. equities frequently exhibit higher volatility around earnings seasons and policy shifts, creating sharp intraday moves. Asian markets, by contrast, often display steadier trends influenced by manufacturing cycles and currency policies. For instance, Shanghai Composite charts may show prolonged sideways action during policy uncertainty, unlike the more directional U.S. moves. These behavioral contrasts become especially pronounced during global risk-off events.
Traders benefit from noting these differences when building multi-region portfolios. U.S. sessions can set the tone for overnight Asian gaps, making pre-market analysis essential. Understanding session overlaps, such as the brief window when both New York and Tokyo are active, helps time entries more precisely.
Adapting Indicators to International Data
Standard indicators require adjustment for different market microstructures. Shorter-period moving averages may suit high-frequency Asian sessions, while longer periods work better for U.S. indices. Always normalize volume data because average daily volume varies widely between exchanges. Testing indicator settings on each market’s historical data prevents misinterpretation of signals.
Another key adaptation involves accounting for holidays and half-days that differ globally. Missing these can lead to distorted patterns. Many platforms allow custom sessions, which traders should configure before running scans.
Practical Steps for Cross-Border Technical Scans
- Select a charting platform supporting multiple exchanges and adjust for time zones to ensure accurate candle formation.
- Apply consistent indicators such as 50- and 200-period moving averages across all symbols while allowing slight period tweaks per market.
- Filter for volume thresholds relevant to each market’s average liquidity to avoid low-quality signals.
- Monitor correlation matrices to spot decoupling events between regions that often precede major rotations.
- Backtest patterns on historical international data before live implementation to validate edge.
- Include economic calendar overlays to anticipate volatility spikes around regional data releases.
These steps help reduce noise from single-market biases and create a repeatable process.
Case Studies of Recent Volatility Patterns
Recent volatility episodes demonstrate the value of technical adaptation. During periods of heightened uncertainty, double-top formations appeared simultaneously on U.S. and European indices, while Asian markets formed bullish flags. Recognizing these divergences allowed traders to rotate exposure effectively. Another pattern involved breakout failures on low Asian volume followed by U.S. follow-through moves, highlighting the need for multi-market confirmation.
A third case showed how RSI divergences on the Hang Seng preceded a sharp rebound that later influenced U.S. futures. Studying these examples helps traders develop pattern-recognition skills across borders. 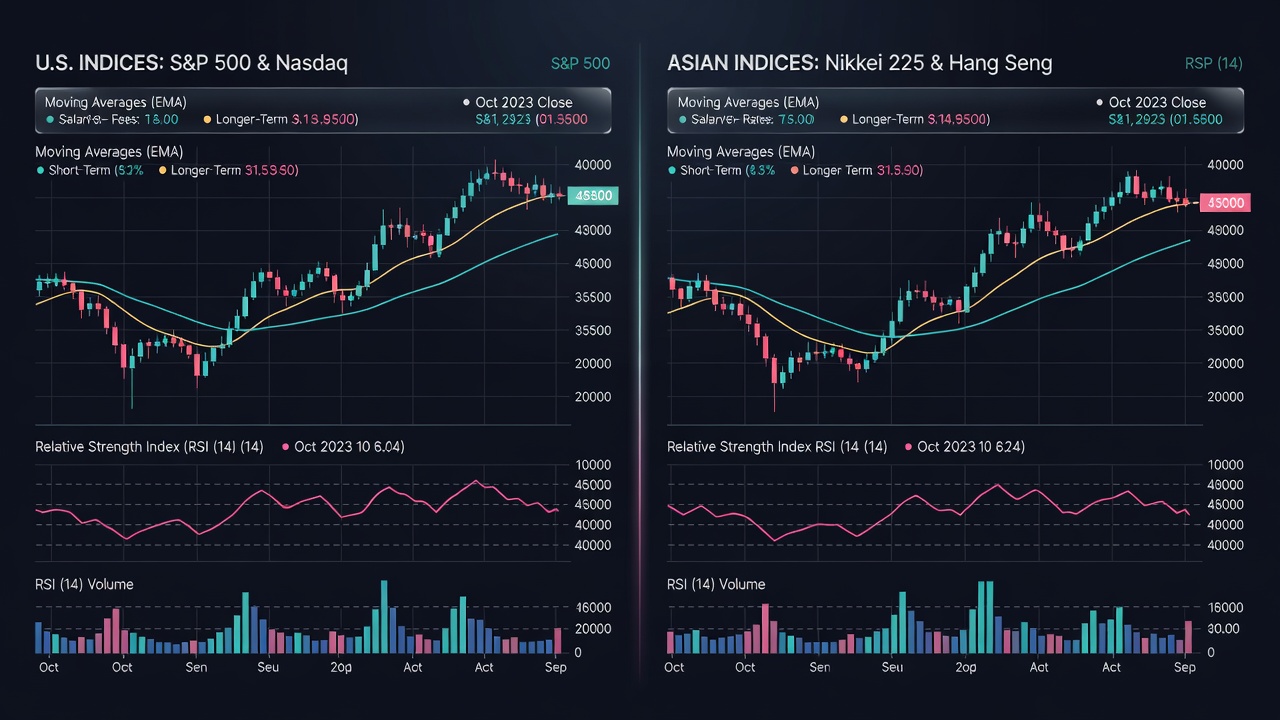
Manual Versus Automated Analysis Methods
Manual analysis offers deep contextual insight and flexibility when interpreting unusual global events. Automated systems, however, excel at scanning thousands of symbols across time zones quickly. Many traders combine both: using algorithms for initial alerts and manual review for final decisions. Automated tools reduce emotional bias but may miss nuanced factors like holiday schedules or sudden regulatory changes affecting specific regions.
Hybrid approaches often yield the best results, especially when automation flags candidates and humans verify against broader macroeconomic context from sources such as the International Monetary Fund.
Mistakes to Avoid in Global Technical Analysis
- Ignoring time-zone differences that distort moving-average crossovers.
- Applying identical stop-loss percentages without considering local liquidity levels.
- Overlooking currency-adjusted charts when analyzing non-U.S. indices.
- Failing to retest strategies after major policy regime changes.
FAQ on Risk Considerations
- How do currency risks affect technical signals? Exchange rate movements can distort foreign index charts; always review both local and USD-denominated versions.
- What timeframes work best for global scans? Daily and weekly charts provide reliable trend context, while 4-hour charts help with entry timing.
- Are stop-loss orders reliable across borders? Liquidity gaps in thinner markets can trigger slippage, so wider stops or options-based protection may be preferable.
- How often should indicators be recalibrated? Review settings quarterly or after major macroeconomic regime shifts.
- Should traders focus on one region first? Starting with familiar markets before expanding reduces initial complexity.
Conclusion
Technical analysis remains a powerful lens for spotting 2026 stock market trends beyond domestic borders. By mastering regional nuances, refining cross-border scans, and blending manual with automated approaches, traders position themselves for informed decisions amid ongoing uncertainty. Continuous practice with real-time data builds the edge needed for global opportunities. Resources from institutions like the U.S. Securities and Exchange Commission can further support regulatory awareness when trading internationally.
No comments yet. Be the first!