 Bullish Portfolio
Introduction to Relative Strength in 2026 Markets
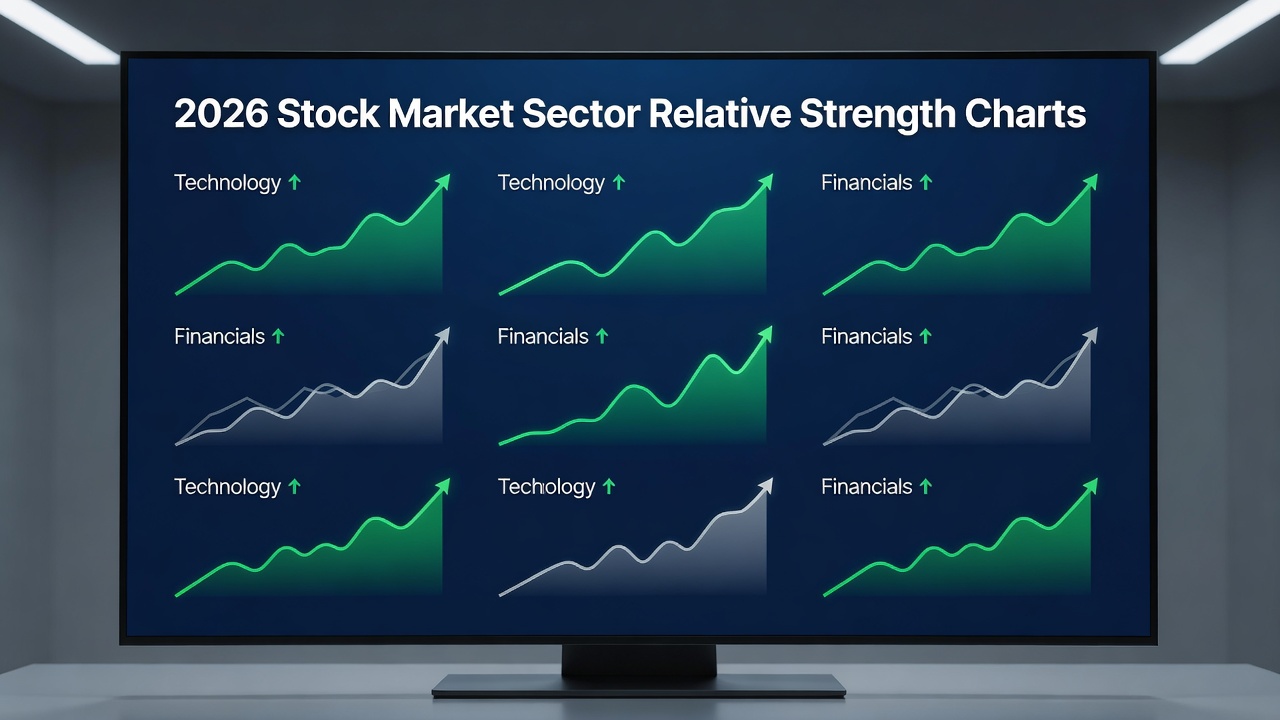
Traders navigating 2026 market volatility need tools that go beyond simple price charts. Relative strength analysis helps identify sectors poised to outperform broader benchmarks by comparing performance ratios rather than absolute price movements. This approach is especially valuable amid shifting economic conditions and sector rotations driven by interest rate policies, technological advancements, and global supply chain adjustments. In an environment where broad indices may experience swings of 15-20% within months, focusing on relative leaders allows investors to capture alpha even when the overall market trends sideways or declines modestly.
Unlike absolute price action, which tracks an asset's standalone gains or losses, relative strength measures how one security or sector performs against another, such as the S&P 500. This distinction allows traders to focus on leadership rather than overall market direction, providing a clearer edge during periods of economic uncertainty expected throughout 2026.
Relative Strength Versus Absolute Price Action
Absolute price action focuses on whether a stock or index is rising or falling in isolation. While useful for trend identification, it often masks underperformance relative to peers. In contrast, relative strength reveals true leadership by dividing the price of one asset by a benchmark. For instance, a sector may rise modestly while still outperforming a declining market, signaling strength worth capturing. Consider a scenario where the S&P 500 drops 5% over a quarter but a defensive sector like utilities only falls 1%; the relative strength ratio would climb, highlighting resilience.
This ratio-based method filters noise from broad market swings, making it ideal for 2026's anticipated volatility patterns driven by interest rate changes and geopolitical factors. By emphasizing outperformance, traders can rotate capital efficiently into winning areas rather than holding positions that merely follow the market average.
Calculating Relative Strength Ratios: Step-by-Step
Follow these steps to compute relative strength ratios effectively and apply them to real-world decisions:
- Select the target sector ETF or stock and a benchmark index like the S&P 500 or Russell 2000.
- Divide the closing price of the target by the benchmark's closing price on the same date.
- Plot the resulting ratio over time, ideally on a weekly chart for trend clarity and to smooth daily noise.
- Look for rising ratios to confirm outperformance and falling ratios for underperformance; track changes over 4- to 12-week windows.
- Incorporate volume data where available to ensure moves are supported by institutional participation.
Repeat calculations across multiple periods to validate consistency. Free charting platforms support this process without requiring advanced software, allowing even retail traders to implement professional-grade analysis quickly.
Spotting Strength Divergences
Divergences occur when price action and relative strength move in opposite directions. A bullish divergence appears when prices make lower lows but the relative strength ratio makes higher lows, often preceding breakouts as hidden buying pressure builds. Bearish divergences warn of weakening leadership even as prices hold steady, frequently preceding sector rotations or corrections.
Monitor these signals on major indices such as the Nasdaq-100 or Dow Jones Industrial Average for early sector rotation clues. In 2026, with potential for rapid shifts in growth versus value leadership, divergences can provide weeks of advance notice before price confirms the move.
Combining Relative Strength with Moving Averages
Enhance reliability by overlaying moving averages on relative strength charts. A 50-day and 200-day moving average crossover on the ratio line adds confirmation. When the shorter average crosses above the longer one while the ratio trends upward, sector strength gains credibility and reduces the likelihood of whipsaws.
This combination reduces false signals common in choppy markets. Traders can also experiment with exponential moving averages for faster response in high-volatility periods typical of 2026.

Practical Examples on Major Indices
Consider the technology sector versus the S&P 500 in early 2026 scenarios. If the ratio climbs steadily above its 200-day average, allocate more exposure to tech ETFs while reducing holdings in lagging areas. Similarly, compare energy and financials against the Russell 2000 to uncover small-cap leaders during recovery phases following policy announcements.
Another example involves healthcare versus consumer discretionary: during periods of economic softening, healthcare ratios often rise as investors seek stability. These examples demonstrate how ratio analysis highlights rotations before they become obvious in price alone, enabling proactive portfolio adjustments.
Strong Versus Weak Sectors: Comparison Table
| Sector | Relative Strength Signal | Performance vs Benchmark | Action |
|---|---|---|---|
| Technology | Rising ratio, above MA | Outperforming | Overweight |
| Energy | Falling ratio, below MA | Underperforming | Underweight |
| Healthcare | Neutral ratio, flat | In-line | Monitor |
| Financials | Sharp ratio increase | Strong outperformance | Accumulate |
| Utilities | Stable ratio with mild uptrend | Modest outperformance | Hold for defense |
Review this table weekly and update signals based on fresh ratio data to maintain alignment with current market leadership.
Weekly Review Checklist for Traders
- Update relative strength ratios for top 10 sectors every Friday close using consistent data sources.
- Flag any ratio crossing its 50-day moving average and note the direction of the cross.
- Review divergence patterns on weekly charts across at least three major indices.
- Cross-reference with volume trends and sector-specific news for added confirmation.
- Adjust portfolio weights based on the strongest ratios, limiting any single sector to 25-30% of equity exposure.
- Document changes to track performance over rolling four-week periods and refine the process.
- Compare current ratios against the same period one year prior to identify seasonal patterns.
- Rebalance only when multiple indicators align rather than reacting to single data points.
This disciplined routine aligns decisions with evolving 2026 volatility and promotes consistent execution.
Common Pitfalls and FAQ
What causes false breakouts in relative strength?
False breakouts often stem from low-volume ratio spikes or news-driven anomalies. Always confirm with multiple timeframes and moving averages before acting.
How often should ratios be recalculated?
Weekly reviews strike the best balance between responsiveness and avoiding overtrading in 2026 conditions.
Can relative strength work with individual stocks?
Yes, apply the same ratio method to stocks versus their sector ETF for granular selection and enhanced conviction.
Does relative strength account for dividends or sector-specific risks?
Basic ratios use price only; for total return considerations, adjust inputs to include dividend data where available from reliable sources.
Conclusion
Relative strength analysis equips traders with a robust framework for sector outperformance in 2026. By mastering ratio calculations, divergences, and moving average confirmations, investors can build checklists that deliver consistent edges. Start applying these methods today to stay ahead of market rotations and improve long-term results.
Further reading is available at Investopedia, FRED Economic Data, and U.S. Securities and Exchange Commission.

No comments yet. Be the first!