 Bullish Portfolio
Introduction
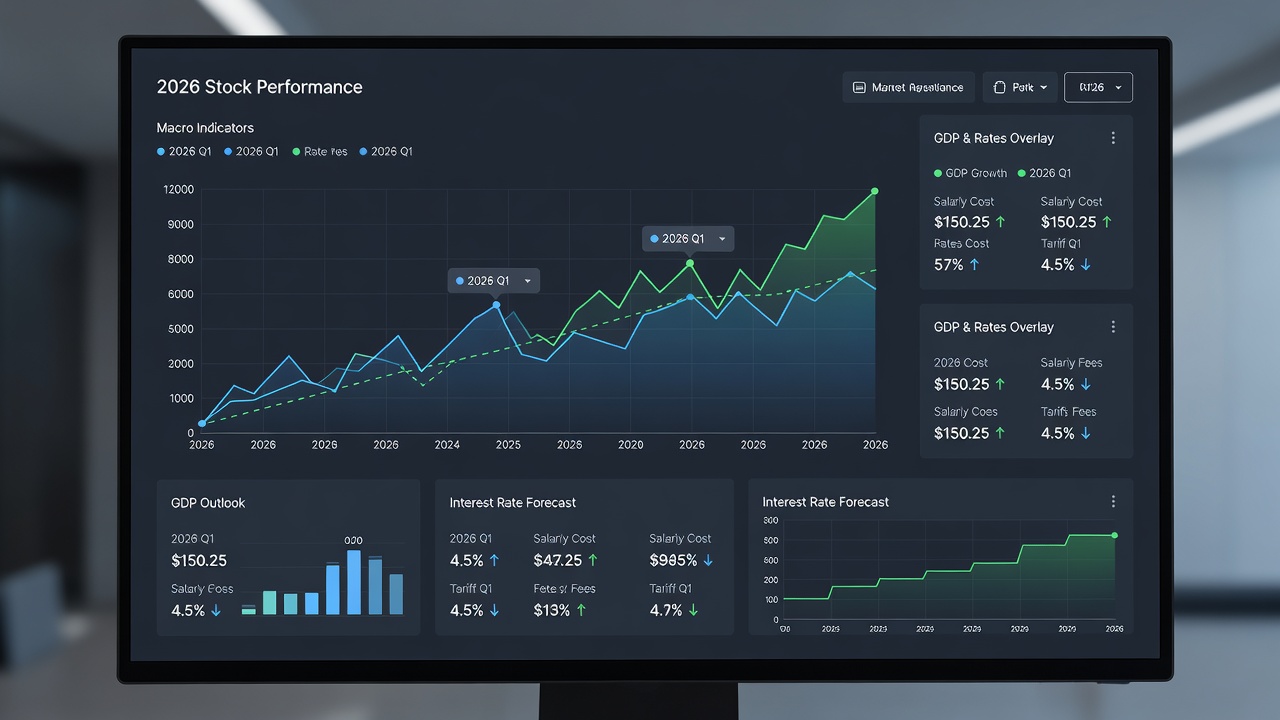
Integrating macroeconomic data with technical analysis provides traders and investors a more robust framework for forecasting stock market trends in 2026. By combining broad economic signals with price charts, volume patterns, and support levels, analysts can better anticipate shifts driven by policy changes or economic releases. This approach moves beyond pure chart reading to incorporate real-world economic context that often drives sustained moves in equities. In volatile environments, relying solely on technical patterns can lead to missed opportunities or unexpected reversals when major data drops. The hybrid method helps confirm or refute signals from moving averages, candlestick formations, and momentum oscillators by cross-referencing them with upcoming or recent macro events.
This guide walks through practical methods to overlay macro indicators on technical setups, helping reduce noise and improve decision-making during volatile periods. Readers will gain concrete workflows, historical context from recent market cycles, and tools to build a repeatable routine that accounts for both quantitative price data and qualitative economic drivers.
Key Macroeconomic Indicators for Stock Analysis
Core indicators include GDP releases and interest rate decisions from central banks. These data points often trigger immediate market reactions visible on price charts. For example, stronger-than-expected GDP growth can push indices higher while coinciding with increased volume near resistance levels. Other useful metrics encompass employment reports, inflation readings, and manufacturing surveys, each of which can amplify or dampen technical breakouts depending on their deviation from consensus expectations.
Correlating GDP Releases with Price Action
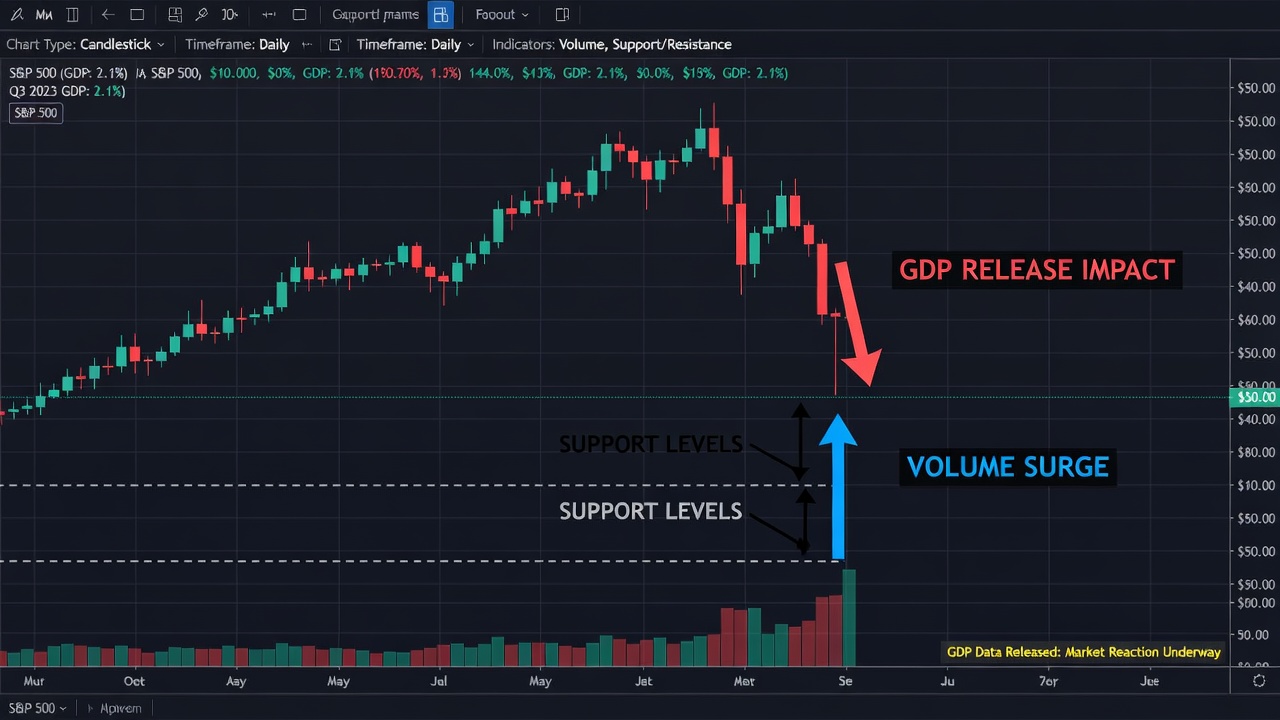
GDP announcements frequently align with breakouts or breakdowns. Positive surprises may confirm bullish technical patterns such as ascending triangles, while negative prints can accelerate moves below key support zones. Traders often observe that GDP beats tend to produce multi-day follow-through when accompanied by rising on-balance volume, whereas misses frequently lead to extended consolidation or reversal patterns on the daily timeframe.
Interest Rate Shifts and Volume Spikes
Rate hikes or cuts influence borrowing costs across sectors. Technical traders monitor how these decisions coincide with volume surges at moving average crossovers, providing confirmation for trend continuation or reversal. A dovish surprise from the Federal Reserve, for instance, can ignite sharp rallies that test previous highs with expanding volume, validating the move as more than a short-term technical bounce.
Step-by-Step Workflow for Overlaying Economic Calendars
- Import an economic calendar from a reliable source such as the FRED database into your charting platform. Ensure the calendar includes consensus estimates so you can quickly gauge surprise magnitude once data arrives.
- Mark high-impact events like GDP and FOMC meetings directly on daily or weekly charts. Use vertical lines or shaded zones to highlight the exact release time and avoid trading the first few minutes when spreads widen.
- Identify nearby technical levels including support, resistance, and volume-weighted average price. Note any confluence between macro event timing and these levels to prioritize setups with higher probability.
- Monitor pre-event consolidation patterns for clues on post-release direction. Tight ranges or declining volatility often precede larger moves once the data hits the tape.
- Validate signals with multi-timeframe analysis after the data release. Check whether the initial reaction holds on both the hourly and daily charts before committing larger position sizes.
Real-World Case Studies from Recent Market Phases
During the 2023-2024 bull phase, GDP beats aligned with sustained rallies above the 50-day moving average, accompanied by rising volume. Stocks in technology and consumer discretionary sectors showed particularly strong follow-through when positive growth data reinforced existing uptrends. In contrast, the 2022 bear market saw rate hike surprises accelerate breakdowns through major support levels on elevated volume, catching many purely technical traders off guard as moving average crossovers failed to provide timely warnings.
Another instructive period occurred in late 2024 when mixed inflation data created choppy price action around key moving averages. Traders who waited for volume confirmation after the release avoided false breakouts that reversed within hours. These examples illustrate how macro context can refine entry and exit timing beyond what charts alone reveal.
Comparison of Indicator Responses
Understanding typical market responses helps set realistic expectations. The following table summarizes common patterns observed across multiple cycles:
| Macro Event | Typical Price Reaction | Volume Behavior | Support/Resistance Impact |
|---|---|---|---|
| Strong GDP Print | Bullish breakout | Spike on confirmation | Breaks above resistance |
| Rate Hike Surprise | Bearish reversal | High volume selloff | Tests lower support |
| Mixed GDP Data | Consolidation | Lower average volume | Range-bound near pivot |
| Inflation Miss | Short-term rally | Moderate increase | Retests prior highs |
These responses are not guarantees but provide a baseline for scenario planning. Combining them with sector-specific technical analysis further improves accuracy.
Avoiding False Signals During High-Impact News
FAQ: How can traders filter noise around economic releases?
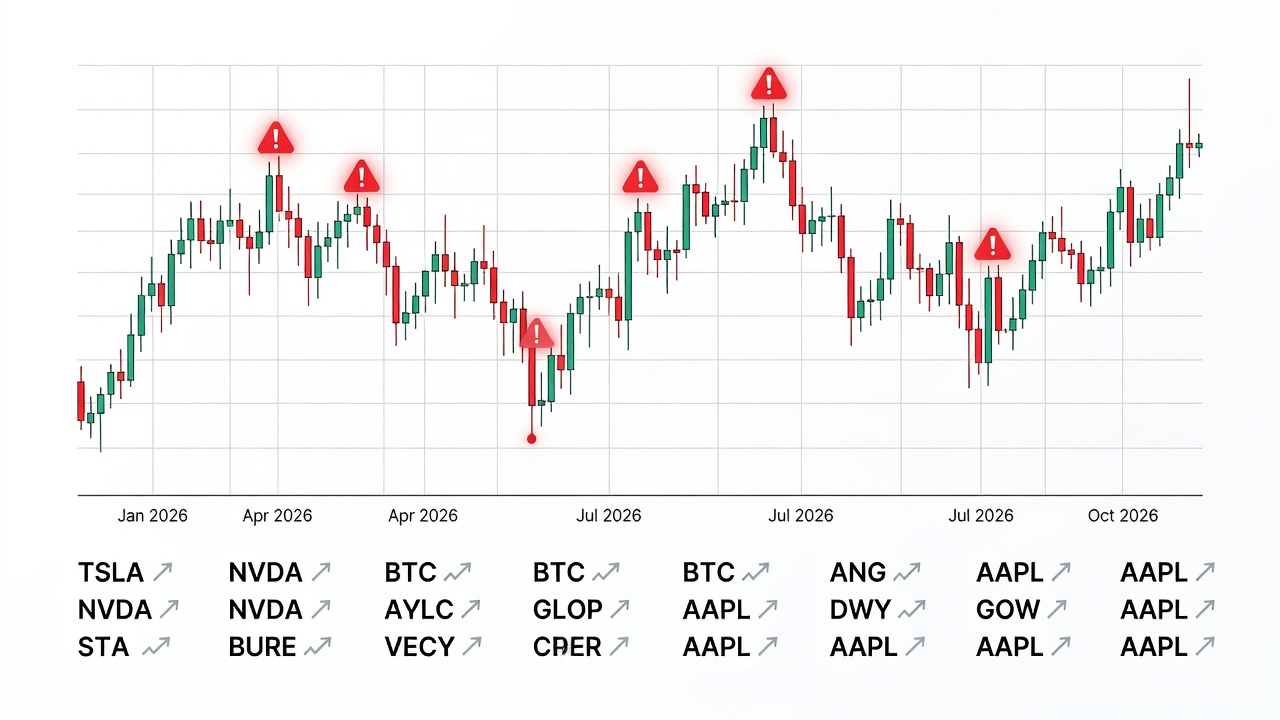
Wait for the initial 15-30 minutes of post-release trading to confirm direction rather than reacting to headline spikes. Combine with technical filters such as RSI divergence to reduce whipsaws. Additionally, review the full data breakdown rather than the headline number alone, as revisions to prior periods can shift interpretations significantly.
FAQ: What role does volume play in validating macro-driven moves?
Authentic breakouts show above-average volume. Low-volume reactions often reverse quickly, signaling false signals tied to temporary news flow. Tracking cumulative volume delta across multiple sessions after the event provides further confirmation of institutional participation.
Actionable Checklist for Building a Hybrid Routine
- Review the weekly economic calendar every Sunday evening and highlight events likely to move your holdings.
- Flag events with potential to move your watchlist stocks by more than 2% based on historical volatility.
- Backtest historical correlations between macro prints and your preferred technical setups using at least two years of data.
- Maintain a trading journal noting both macro context and technical outcomes for continuous improvement.
- Adjust position sizing ahead of high-impact releases to manage risk exposure during uncertain periods.
- Cross-reference multiple data sources including Federal Reserve announcements and Bureau of Economic Analysis releases for comprehensive context.
Mistakes to Avoid When Blending Macro and Technical Analysis
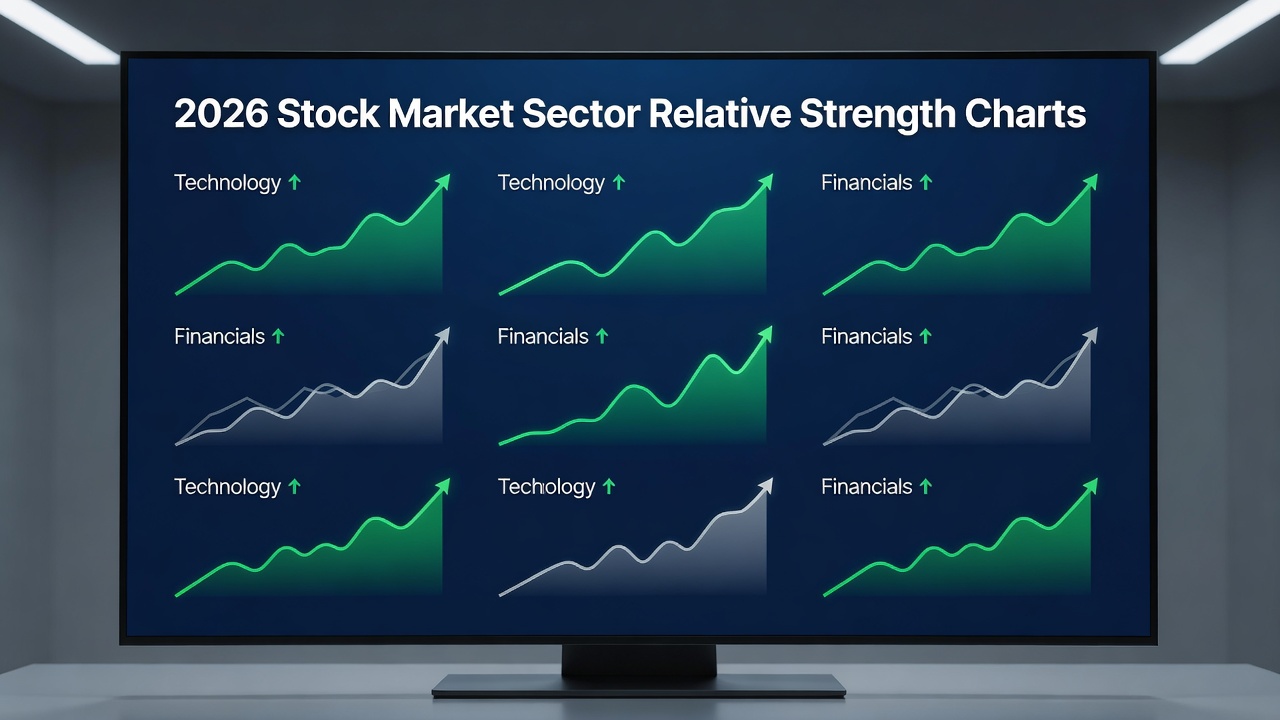
One common error is overreacting to every data point without considering revisions or context. Another is ignoring sector rotation that often follows macro shifts, leading to positions in lagging areas. Traders should also avoid using outdated calendars that miss time changes or holiday adjustments. Finally, failing to update technical levels after major macro events can leave stops too wide or too tight relative to new volatility regimes.
Conclusion
Blending macroeconomic indicators with technical analysis equips investors to navigate 2026 markets with greater precision. Consistent application of the workflows and checklists outlined here supports more informed trend forecasts while minimizing emotional reactions to news. By treating macro data as a filter rather than a standalone signal, analysts can build resilient strategies that adapt to evolving economic conditions.
No comments yet. Be the first!