 Bullish Portfolio
Introduction
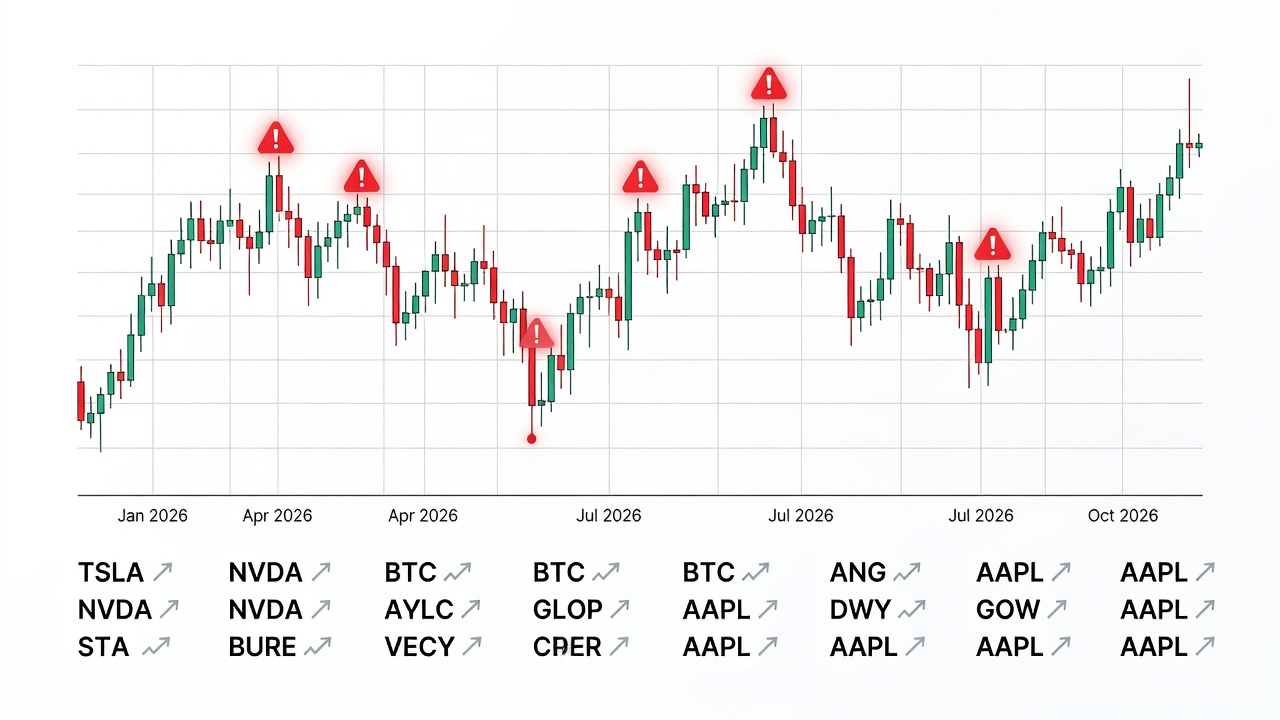
Technical analysis remains a cornerstone for traders navigating volatile markets in 2026. However, even experienced investors fall into recurring traps that undermine their edge. This guide examines five frequent pitfalls, drawing on examples from sectors like technology and energy, and provides actionable corrections. In 2026, rapid shifts driven by geopolitical events and technological advancements have amplified the consequences of common analytical errors. Traders who refine their approach can better capture opportunities while protecting capital during sharp reversals in high-volatility areas such as semiconductors and renewable energy stocks.
Pitfall 1: Over-Reliance on a Single Indicator
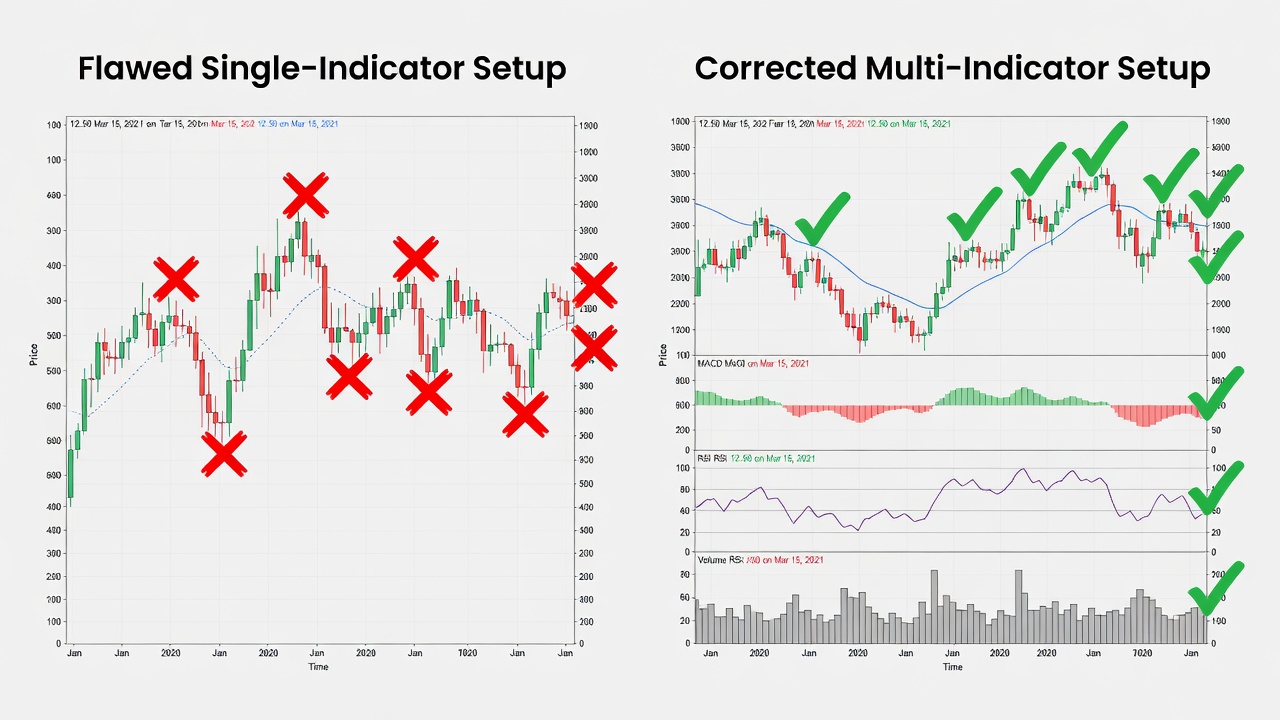
Many traders depend exclusively on one tool such as the RSI. This approach ignores confluence and leads to false signals during rapid sentiment shifts. For instance, in early 2026, several momentum stocks showed oversold RSI readings yet continued declining because broader market liquidity tightened. Relying solely on one metric creates blind spots, especially when that indicator lags behind price action in fast-moving sectors. Step-by-step fixes include combining at least three indicators from different categories—momentum, trend, and volume. Always validate signals across daily and weekly charts before entering positions. Additionally, backtest the combined approach on historical data from similar volatility periods to confirm robustness. This layered method reduces noise and improves entry timing significantly.
Pitfall 2: Ignoring Broader Market Context
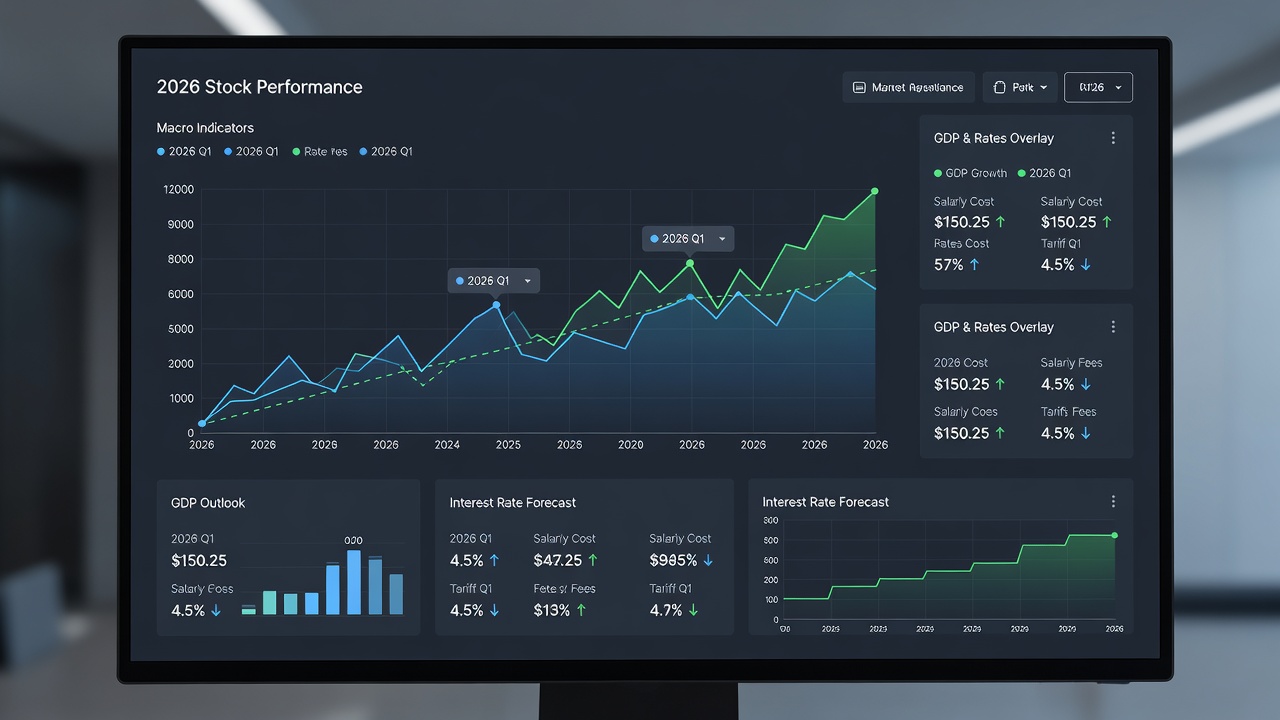
Charts do not exist in isolation. Traders who overlook macroeconomic releases or sector rotations often misread setups. A classic case occurred with semiconductor names when unexpected tariff announcements reversed technical breakouts. In 2026, global supply chain disruptions and policy changes have made external factors even more influential. A flawed chart might highlight a clean breakout while ignoring rising VIX levels. The corrected version overlays sector ETF performance to confirm alignment. Traders should integrate economic calendars into their routine and cross-reference with broader indices before committing to any position. This contextual awareness prevents costly misinterpretations in interconnected markets.
Learn more at Investopedia.
Pitfall 3: Neglecting Multiple Timeframes
Using only one timeframe creates tunnel vision. A bullish daily pattern can quickly fail when the weekly trend points lower. Volatile energy stocks in 2026 frequently demonstrated this mismatch, where intraday gains evaporated due to longer-term resistance. Always start analysis on the higher timeframe to establish directional bias. Drill down only after confirming the overall trend, then validate entries with at least two lower timeframes. This hierarchical process helps identify high-probability trades and avoids chasing noise on lower charts. Practical examples include reviewing monthly charts for major support before examining four-hour setups for precise entries in energy sector names.
Pitfall 4: Disregarding Volume Analysis
Price action without volume context often produces unreliable breakouts. Low-volume moves in AI-related equities during mid-2026 frequently reversed within days, catching traders off guard. Volume serves as confirmation of conviction behind price moves. Require volume at least 150% above the 20-day average on breakout attempts as a risk mitigation tactic. Incorporate volume oscillators and compare against sector averages to spot divergences early. This discipline filters out weak signals and enhances the reliability of technical patterns across volatile sectors.
Pitfall 5: Overtrading Every Signal
Discipline separates professionals from amateurs. Chasing every crossover or pattern leads to excessive commissions and emotional fatigue. In 2026's fast-paced environment, this habit erodes returns quickly. Practical checklists help enforce restraint: limit trades to setups meeting all five confluence rules, maintain a trading journal reviewed weekly, and set a maximum of three open positions at once. Reviewing past trades for patterns of overtrading reveals behavioral triggers that can be addressed through structured routines.
Real-World Stock Examples from Volatile Sectors
Consider a technology stock that broke resistance on low volume in Q1 2026; the move reversed sharply once broader market context was considered. Similarly, an energy name showed strong RSI divergence yet failed because weekly timeframe trends were ignored. These cases illustrate how combining fixes across pitfalls creates more resilient strategies. Traders benefit from documenting such examples in their journals to recognize parallels in future setups.
Risk Mitigation Tactics and Comparisons
Flawed setups often feature isolated indicators without context, while corrected charts display multi-layered confirmation. Implementing these changes consistently lowers drawdowns. Compare your own charts side-by-side with corrected versions to identify gaps. Additional tactics include setting alerts for volume spikes and macroeconomic events to stay proactive rather than reactive.
Practical Checklists for 2026 Traders
- Pre-Market Routine: Review economic calendar, sector performance, and major index trends.
- Chart Review: Confirm trend direction, volume support, and multiple timeframes alignment.
- Entry Rules: Require minimum confluence score of 7/10 across indicators and context.
- Risk Management: Never risk more than 1% of capital per trade and use defined stop levels.
- Post-Trade Analysis: Log every decision and outcome for weekly review sessions.
FAQ
How do I start avoiding these pitfalls immediately?
Begin by auditing your last ten trades against the five pitfalls listed above and note recurring mistakes. Create a simple scoring system for each trade to track improvement over time.
Are these issues unique to 2026 markets?
While market conditions evolve, the core behavioral and analytical errors remain consistent across cycles. The increased volatility in 2026 simply magnifies their impact.
Which volatile sectors should I monitor most closely?
Technology, semiconductors, and renewable energy continue to exhibit the sharpest moves and therefore the highest risk of misreads. Focus on these for applying the outlined corrections first.
What tools can help enforce multiple timeframe analysis?
Most charting platforms allow simultaneous viewing of different periods. Set default layouts that always include weekly and daily views side by side.
Additional guidance is available from U.S. Securities and Exchange Commission and Federal Reserve.
Conclusion
Mastering technical analysis in 2026 requires deliberate avoidance of these common traps. By implementing the fixes, checklists, and multi-timeframe discipline outlined here, traders can significantly improve decision quality and long-term results. Consistent application turns potential pitfalls into structured advantages in any market environment.

No comments yet. Be the first!