 Bullish Portfolio
Introduction to AI in Technical Stock Analysis
As markets grow increasingly volatile in 2026, traders are turning to AI tools to sharpen their technical analysis skills and stay ahead of rapid shifts. This comprehensive guide explores practical applications of AI for pattern recognition, news sentiment scraping, and backtesting workflows. Rather than replacing traditional methods, these technologies augment core charting techniques to help identify emerging trends faster and more accurately. Technical analysis has long relied on indicators like moving averages, RSI, and Fibonacci retracements. AI extends these capabilities by processing vast datasets in real time, revealing subtle correlations that human analysts might overlook during high-pressure trading sessions.
Beginners and intermediate traders benefit most when they integrate AI thoughtfully without discarding foundational knowledge of support and resistance levels or volume analysis. The result is a hybrid approach that combines human intuition with computational power, allowing for more informed decisions in fast-moving sectors such as technology, energy, and healthcare equities.
Machine Learning Models for Pattern Recognition
Machine learning excels at detecting complex chart patterns beyond simple triangles or head-and-shoulders formations. Supervised models trained on historical price data can classify candlestick sequences with high accuracy, while unsupervised approaches like clustering identify regime shifts in volatility or liquidity conditions. In 2026 scenarios, traders feed daily OHLC data from major indices into models such as convolutional neural networks. These networks treat price charts like images, spotting micro-patterns across multiple timeframes that span intraday to weekly views.
Reinforcement learning agents further optimize entry and exit rules by simulating thousands of trades on live market feeds, learning from both successful and failed outcomes. For instance, a model might recognize an emerging double-bottom formation combined with decreasing volatility, signaling a potential reversal that traditional indicators alone would flag only after confirmation. Traders can fine-tune these models using transfer learning from pre-trained financial datasets, reducing the need for massive local computing resources. This depth allows detection of rare events like flash crashes or sector rotations that occur infrequently but carry significant impact.
Sentiment Scraping from News Feeds
News and social media influence price action rapidly, often within minutes of major announcements. AI-powered natural language processing scrapes headlines, earnings transcripts, regulatory filings, and X posts to generate sentiment scores that complement technical signals. Positive or negative spikes frequently precede momentum shifts, providing an edge when aligned with chart patterns or volume surges. Tools parse unstructured text using transformer-based models, assigning polarity values between -1 and 1 while also extracting entity-specific context such as mentions of supply chain disruptions or management changes.
For example, a sudden negative sentiment surge around a semiconductor stock might warn of an impending breakdown even if the chart still shows an uptrend supported by moving averages. Integrating these scores with technical overlays creates composite indicators that filter out noise from low-quality sources. In 2026, real-time scraping capabilities have improved through better API access and edge processing, enabling traders to react to global events like policy announcements from central banks before they fully reflect in price action.
Automated Backtesting Workflows
Backtesting validates strategies before live deployment and remains essential for risk management. AI automates this process by running Monte Carlo simulations and walk-forward optimization across rolling windows of recent market data. This reveals strategy robustness under varying conditions such as interest rate fluctuations, geopolitical tensions, or earnings seasons. Users define rules in code or no-code interfaces, then let the platform execute millions of permutations while accounting for slippage and partial fills.
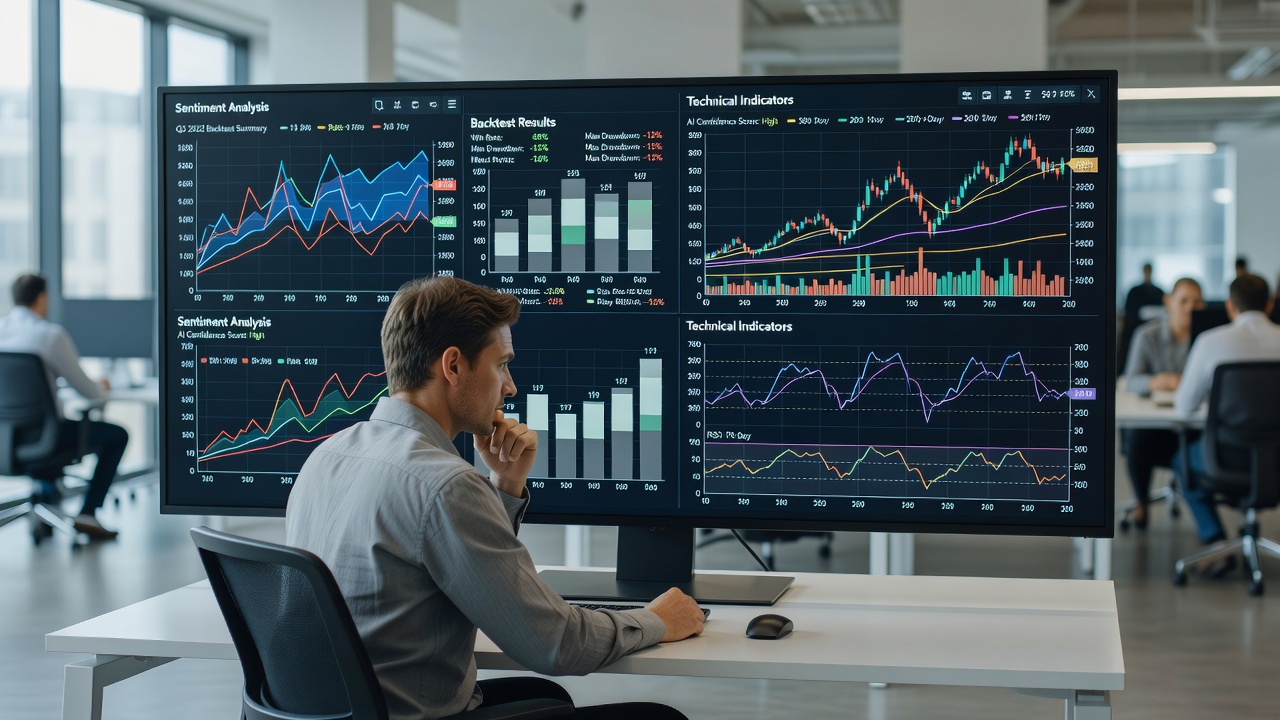
Results include detailed metrics such as Sharpe ratio, maximum drawdown, win rate, and profit factor, helping refine parameters systematically. A practical example involves testing a moving-average crossover strategy enhanced with AI pattern filters on 2026 equity data; the workflow might show improved performance during trending markets but underperformance in sideways conditions, prompting the addition of a volatility filter. Such automation saves hours of manual spreadsheet work while highlighting overfitting risks that can erode real-world results.
Comparing AI Tools with Traditional Technical Analysis
Traditional methods offer transparency and speed for simple setups that many traders have mastered over years. AI adds depth through multi-factor analysis but requires ongoing data quality checks and attention to model interpretability. Hybrid approaches—overlaying AI signals on classic indicators such as MACD or Bollinger Bands—often yield the best results for most market participants. Authoritative resources like Investopedia provide foundational explanations of both approaches for further study and comparison.
AI reduces emotional bias by enforcing data-driven decisions, yet traders must monitor for overfitting to historical noise. Traditional charting builds intuition that AI outputs can validate or challenge during live sessions. The key advantage lies in scalability: while a human can track a handful of charts simultaneously, AI systems monitor hundreds of assets across global exchanges without fatigue.
Step-by-Step Setup Examples Using 2026 Data
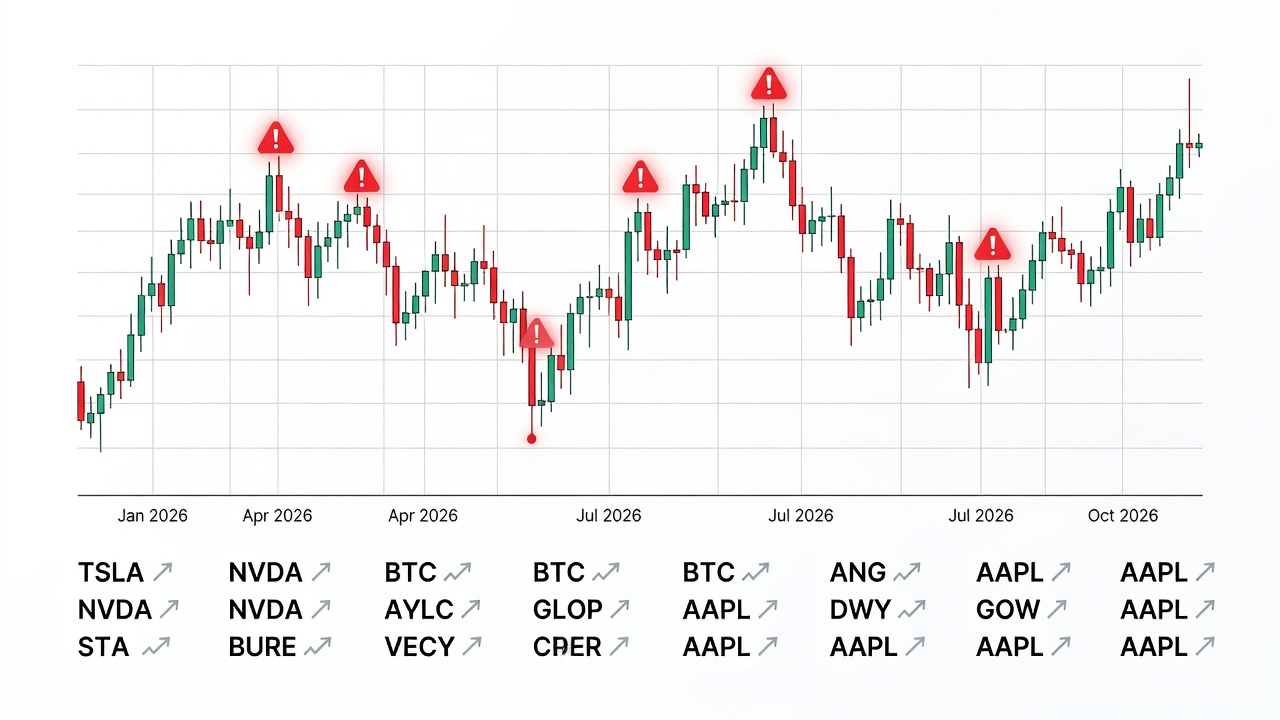
Begin by selecting a platform supporting API access to real-time quotes and historical archives. Import 2026 data for a target asset such as the S&P 500 or a sector ETF. Train a pattern-recognition model on the prior 12 months of price action, then validate performance on the most recent quarter to avoid look-ahead bias. Next, integrate a sentiment API to pull daily news scores and align them with technical indicators on a unified dashboard. Flag divergences where sentiment turns negative while price remains above key moving averages, creating actionable alerts.
Finally, run backtests with realistic assumptions around market impact and execution delays. Review equity curves, trade distributions, and stress-test results under simulated black-swan events. Iterate by adjusting model hyperparameters or adding new data sources such as options flow or macroeconomic releases. This workflow typically requires one to two weeks of initial setup followed by ongoing monitoring and refinement.
Checklist for Selecting AI Software
- Verify data source reliability, update frequency, and coverage of international markets
- Ensure compatibility with existing charting platforms and brokerage APIs
- Review model transparency features, explainability reports, and audit trails
- Test backtesting speed and accuracy on large multi-asset datasets
- Confirm regulatory compliance and data privacy standards for your jurisdiction
- Evaluate customer support responsiveness and availability of community forums or tutorials
- Assess scalability for growing portfolio sizes and real-time alerting capabilities
- Check integration options with risk management tools and portfolio rebalancing features
FAQ: Common Integration Challenges
How do I handle data latency issues?
Use platforms with edge computing capabilities or premium low-latency data feeds to minimize delays between signal generation and order execution, particularly during high-volatility periods.
Can AI replace my existing technical analysis workflow?
No. AI augments rather than replaces core skills. Continue monitoring charts manually to maintain market feel and contextual understanding that pure algorithmic outputs may miss.
What if models produce conflicting signals?
Implement ensemble methods that weight outputs by historical accuracy or require consensus across multiple models before generating trade alerts, reducing false positives.
How should I manage model drift over time?
Schedule periodic retraining using fresh market data and monitor performance metrics; retrain whenever accuracy drops below a predefined threshold such as 70 percent on validation sets.
Common Pitfalls and How to Avoid Them
Many traders encounter issues such as over-reliance on backtest results that fail to account for regime changes. Always include out-of-sample testing and forward-testing periods. Another frequent mistake involves ignoring transaction costs in simulations, which can turn a seemingly profitable strategy into a net loser. Start with small position sizes when transitioning from paper trading to live execution. Finally, maintain detailed logs of model decisions to facilitate post-trade analysis and continuous improvement.
Conclusion
AI tools for 2026 technical stock analysis empower traders to process information at scale while preserving core analytical discipline. By mastering pattern recognition, sentiment integration, and rigorous backtesting, market participants can navigate volatility with greater confidence and precision. Start small, validate thoroughly on recent data, and iterate based on live results. Authoritative resources such as SEC.gov offer additional regulatory context for responsible adoption and ongoing education in this evolving field.
No comments yet. Be the first!