 Bullish Portfolio

Introduction to Backtesting TA Strategies
Traders seeking reliable signals in evolving markets must validate technical analysis (TA) approaches before committing capital. Backtesting allows systematic evaluation of strategies against historical price data, helping confirm whether patterns like breakouts or moving average crossovers hold up under real conditions. This guide focuses on data-validated methods tailored to 2026 stock trends, emphasizing clean datasets, precise rule definitions, and robust performance measurement. In an era of shifting economic policies and technological advancements, relying on untested signals can lead to significant losses. Instead, a structured backtesting process provides empirical evidence of strategy viability, allowing traders to adapt to anticipated volatility spikes and sector rotations expected throughout 2026. By integrating both trend-following and mean-reversion elements, backtesting reveals how strategies perform across bull, bear, and sideways markets.
Selecting Clean Historical Datasets
High-quality data forms the foundation of any backtest. Use adjusted closing prices from reputable providers to account for splits and dividends. Focus on major indices such as the S&P 500 or Nasdaq-100 for broad applicability. Ensure datasets span multiple market regimes, including bull runs, corrections, and high-volatility periods, to simulate 2026 conditions accurately. Traders should source data from providers that offer tick-level granularity when needed and verify completeness by checking for gaps or anomalies. Free sources like Yahoo Finance or paid platforms with institutional-grade feeds reduce errors that could skew results. Always normalize data for corporate actions and include macroeconomic indicators if the strategy incorporates them. This preparation prevents survivorship bias and ensures realistic simulations of live trading environments.
Defining Rules for Key Indicators
Clear, objective rules prevent ambiguity during testing. For moving averages, specify parameters such as a 50-day simple moving average crossing above a 200-day average for long entries. Oscillators like RSI require thresholds, for example entering long when RSI crosses above 30 from oversold territory. Combine indicators with volume filters or price action confirmations to reduce false signals. Additional rules might include ATR-based position sizing or correlation filters with benchmark indices. Document every parameter explicitly, including lookback periods and exit conditions, so the strategy can be replicated or audited later. Avoid vague criteria like “strong momentum” by converting them into quantifiable conditions such as a 14-period ADX reading above 25.
Running Tests on Popular Platforms
Platforms such as TradingView, Python with Backtrader or Zipline, and specialized software enable efficient execution. Start with a simple script that loads data, applies rules, and generates trade logs. Test across multiple timeframes to match intended holding periods. For Python users, libraries like pandas and numpy facilitate rapid data manipulation while vectorized operations speed up computations. TradingView’s Pine Script environment offers visual charting alongside backtest reports. Advanced users may explore QuantConnect for cloud-based multi-asset testing. Begin with a walk-through of loading CSV files, calculating indicators via TA-Lib, and exporting performance statistics. This hands-on approach builds familiarity before scaling to complex multi-strategy portfolios.
Measuring Performance with Key Metrics
Evaluate results using the Sharpe ratio, which measures risk-adjusted returns, and maximum drawdown, which quantifies peak-to-trough losses. Additional metrics include win rate, profit factor, and expectancy. A strategy showing a Sharpe ratio above 1.0 alongside controlled drawdowns demonstrates greater reliability for future deployment. The Sortino ratio further refines risk assessment by focusing only on downside volatility. Calculate profit factor as gross profits divided by gross losses, aiming for values above 1.5. Expectancy combines win rate and average win/loss sizes to project long-term profitability. Review these metrics both in aggregate and across sub-periods to detect regime-dependent weaknesses. Traders should also track trade frequency and holding period statistics to align with personal risk tolerance and capital constraints.
Step-by-Step Example: Backtesting a Breakout Strategy
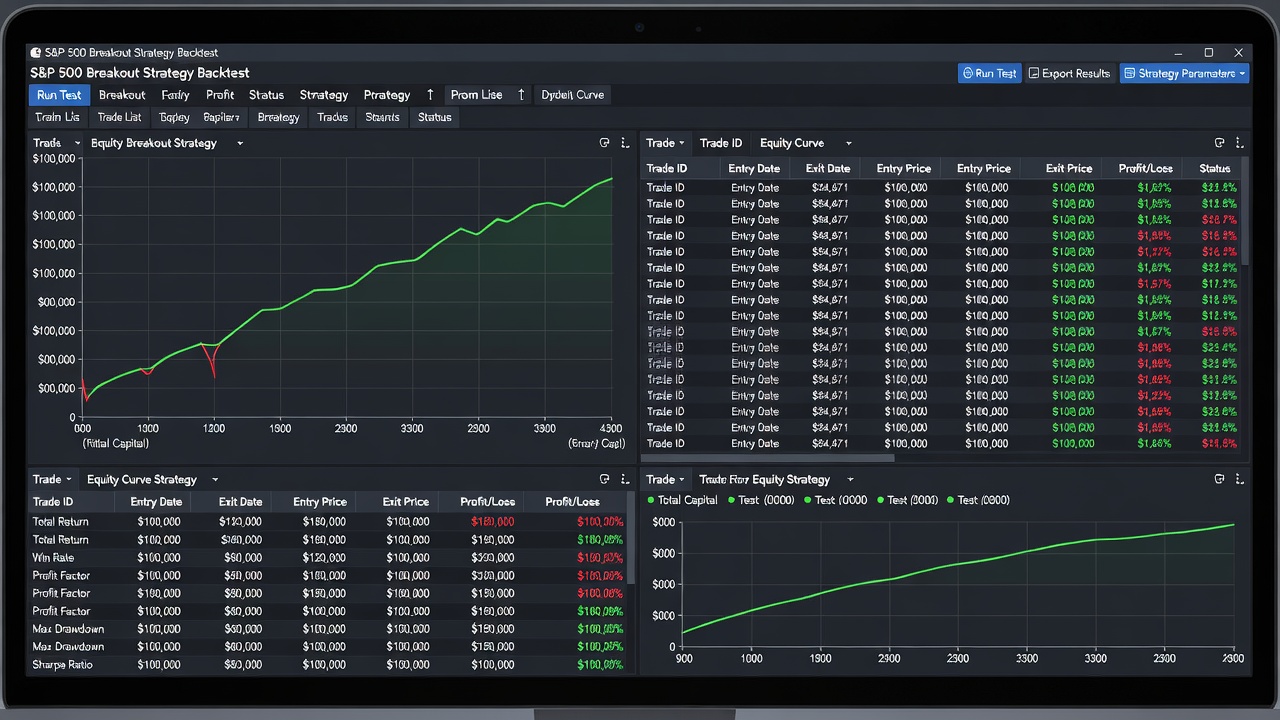
Consider a breakout strategy on the S&P 500. Step 1: Load 10 years of daily data. Step 2: Define entry when price closes above the 20-day high with volume 50% above average. Step 3: Set exit at a 2:1 reward-to-risk ratio or trailing stop. Step 4: Run the test and analyze equity curve. Results typically reveal strong performance in trending markets but whipsaws during ranges. To illustrate, assume an initial capital of $100,000 and 1% risk per trade. The backtest might generate 180 trades with a 42% win rate, average winner of 3.8%, and average loser of 1.9%. The resulting equity curve would show compounded growth during 2017–2021 bull phases while highlighting drawdowns exceeding 18% in 2022. This concrete example demonstrates how to iterate on filters, such as adding a 200-day moving average trend bias, to improve consistency.
Walk-Forward Analysis Versus Simple Optimization
Simple optimization risks curve-fitting parameters to past data. Walk-forward optimization divides data into training and testing windows, re-optimizing periodically. This method better prepares strategies for regime shifts expected in 2026, reducing the chance of degraded live performance. In practice, a 3-year in-sample optimization followed by a 1-year out-of-sample test repeated across the dataset provides robust validation. Compare the two approaches by measuring degradation between in-sample and out-of-sample Sharpe ratios. Walk-forward typically yields more conservative yet realistic expectations, especially when markets experience structural changes such as new regulatory frameworks or technological disruptions.
Addressing Overfitting Risks
Overfitting occurs when a strategy performs exceptionally on historical data but fails forward. Mitigate by limiting parameter variations, using out-of-sample testing, and applying Monte Carlo simulations. Robust strategies maintain consistent metrics across different market periods. Additional safeguards include restricting the number of optimized parameters to fewer than five and enforcing minimum trade counts per optimization window. Cross-validation techniques, such as k-fold partitioning of time series, further expose hidden instabilities. Always demand that a strategy meets minimum performance thresholds on multiple uncorrelated assets before live deployment.
Updating Tests for Emerging 2026 Volatility
As new data arrives, re-run backtests quarterly. Incorporate recent volatility regimes to adjust parameters or filters. This ongoing process ensures strategies remain aligned with current market dynamics. Maintain a changelog of modifications and their impact on key metrics. When volatility clusters appear, test adaptive mechanisms such as dynamic ATR stops or regime-switching filters. Regular updates also help identify when a once-profitable strategy has lost its edge due to increased competition or market maturation.
Common Mistakes to Avoid
- Ignoring transaction costs and slippage, which can turn a theoretically profitable strategy negative in live trading.
- Over-optimizing on a single market regime without testing across bull, bear, and sideways conditions.
- Neglecting liquidity filters that prevent unrealistic fills on thinly traded instruments.
- Failing to account for overnight gaps or corporate events that materially affect results.
Frequently Asked Questions
- How often should I update backtests? Review at least quarterly or after major market events to incorporate fresh volatility patterns.
- What data frequency works best? Daily data suits swing strategies; intraday data is necessary for day trading approaches.
- Can backtesting guarantee future profits? No, but it significantly improves the probability of selecting durable strategies when combined with forward testing.
- Which platform is best for beginners? TradingView offers an intuitive interface while Python provides greater customization for advanced users.
Conclusion
Backtesting TA strategies provides a disciplined path to validating approaches ahead of 2026 trends. By focusing on clean data, precise rules, and rigorous metrics while guarding against overfitting, traders can build greater confidence in their methods. For authoritative guidance on technical analysis concepts, consult resources from Investopedia and explore quantitative methods at QuantStart. Continued learning through Pandas documentation further strengthens implementation skills.
For more on building durable approaches, see our guide to investment strategies.

No comments yet. Be the first!