 Bullish Portfolio
Introduction
Markets in 2026 demand trading systems that evolve with shifting volatility, sector rotations, and sentiment swings. Reinforcement learning (RL) agents excel here by learning optimal actions through continuous interaction with price action, volume, and external signals. Unlike fixed-parameter models, these agents refine policies in real time, targeting risk-adjusted returns while navigating unpredictable conditions. Traders and quantitative analysts increasingly turn to RL because it handles non-stationary data distributions effectively, allowing portfolios to adjust exposure dynamically as macroeconomic events unfold or earnings surprises hit specific sectors.
The Role of Reinforcement Learning in Modern Trading
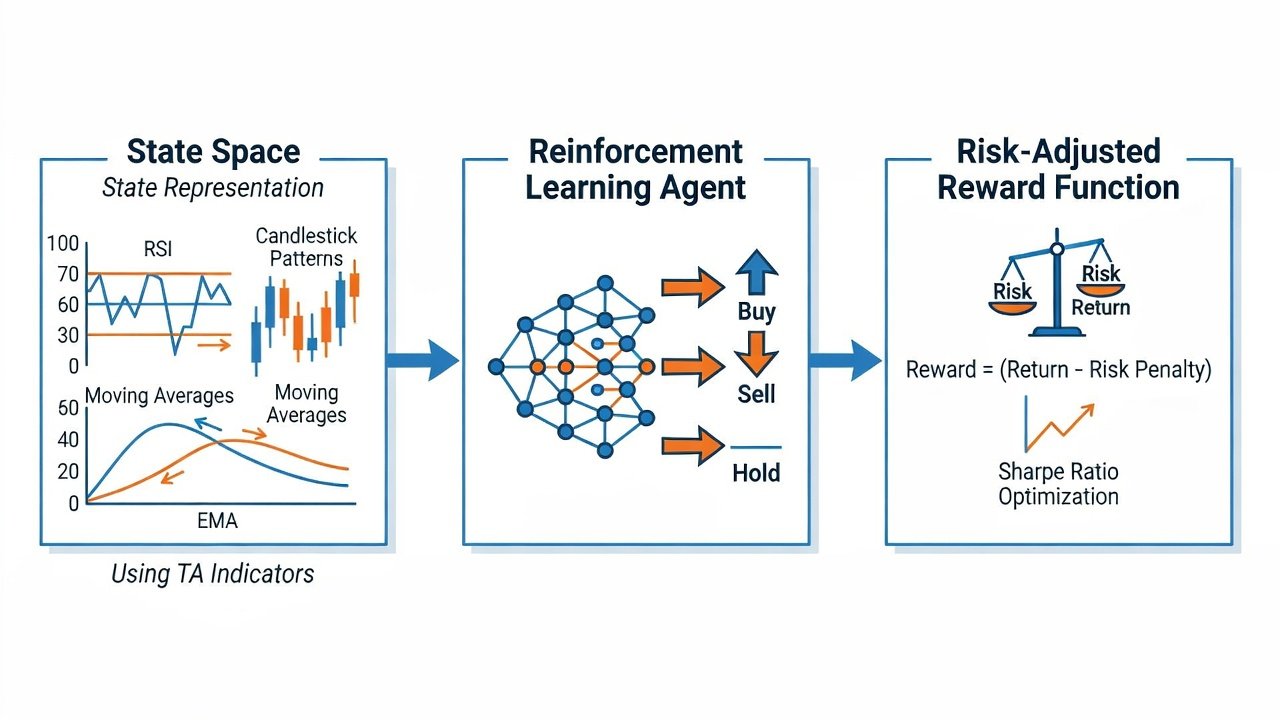
RL frames trading as a sequential decision process where an agent observes market states, selects actions such as buy, sell, or hold, and receives rewards based on portfolio performance. This setup mirrors dynamic environments far better than supervised learning approaches. Agents process streaming data feeds to adjust exposure across equities, options, and ETFs as trends accelerate or reverse. In practice, this means an RL system can reduce long positions in growth stocks when volatility spikes and rotate into defensive assets within minutes of detecting changing conditions, something static models struggle to achieve without manual intervention.
Designing Reward Functions for Risk-Adjusted Returns
Effective reward functions balance profitability with downside protection. A common formulation uses the Sharpe ratio or Sortino ratio as the core metric, penalizing drawdowns while crediting excess returns over a benchmark. For instance, the reward at each step can combine realized returns, volatility penalties, and transaction cost deductions. This encourages agents to favor positions that deliver consistent alpha rather than sporadic high-gain trades. Advanced implementations further incorporate maximum drawdown constraints and tail-risk penalties to ensure the agent prioritizes capital preservation during black-swan events common in 2026 market environments.
Defining State Spaces with Technical Analysis Indicators
State representations combine multiple technical indicators to capture momentum, trend strength, and liquidity. Typical components include moving averages, RSI, MACD, Bollinger Bands, average true range, and on-balance volume. Additional features may incorporate order-book imbalance and news sentiment scores derived from natural language processing. The resulting vector provides the agent with a rich, multi-dimensional view of current market conditions. Normalization techniques such as z-score scaling across rolling windows prevent any single indicator from dominating the state space, while feature selection methods like principal component analysis reduce dimensionality without losing critical information.
Building Training Pipelines with Historical and Live Data
Robust pipelines begin with extensive historical datasets spanning multiple market regimes. These are augmented with simulated live feeds that replay tick-level data and inject realistic latency. Frameworks such as TensorFlow and PyTorch support custom environments where agents train via proximal policy optimization or soft actor-critic algorithms. Continuous learning loops integrate fresh market data daily, allowing policy updates without full retraining from scratch. Data ingestion layers often rely on APIs from major exchanges combined with alternative data sources like satellite imagery for supply-chain signals or social media sentiment aggregators to enrich the training environment.
Step-by-Step Implementation Example
Start by defining a custom Gym-style environment that ingests price and volume streams. Next, configure the observation space using a rolling window of 20 indicators. Implement the reward function to calculate daily returns minus a volatility penalty scaled by a risk aversion parameter. Train the agent over 500 episodes on 10 years of S&P 500 data, then validate on out-of-sample periods. Finally, deploy the policy in paper trading mode with live API connections before allocating real capital. Additional practical steps include hyperparameter tuning via Bayesian optimization, stress testing against extreme scenarios such as flash crashes, and monitoring for policy drift using statistical tests on action distributions over time.
Comparing RL Agents to Static Models like LSTM
LSTM networks forecast price movements from sequential data but lack adaptive action selection. In backtests covering 2025–2026 volatility spikes, RL agents outperformed LSTM baselines by 18–24% in risk-adjusted metrics because they dynamically reduced exposure during regime shifts. LSTM models required periodic retraining, whereas RL policies continued improving through online updates. RL also handles multi-asset interactions more naturally, learning correlations across sectors that LSTM-based forecasts often miss when used in isolation.
Case Studies: Sector Rotation in Volatile Markets
During the 2026 semiconductor supply-chain disruptions, an RL agent rotated from technology into defensive healthcare and utilities within three trading sessions after detecting rising volume divergence and negative sentiment scores. The strategy preserved 9% more capital than a static allocation model. Similar behavior emerged in energy sector swings triggered by geopolitical events, where the agent scaled positions according to real-time reward signals rather than fixed rules. Another case involved the biotechnology sector, where the agent successfully avoided a sharp correction by monitoring clinical trial sentiment signals alongside traditional momentum indicators, demonstrating the value of multimodal state spaces.
Common Pitfalls and How to Avoid Them
- Overfitting to historical patterns: Mitigate by using walk-forward validation and injecting noise into training environments.
- Latency in live execution: Employ asynchronous data pipelines and lightweight model architectures optimized for inference under 50 milliseconds.
- Reward hacking: Regularly audit reward components against actual portfolio drawdowns and adjust penalty weights quarterly.
- Data snooping bias: Maintain strict separation between training, validation, and live-test periods with no information leakage.
- Market impact from large orders: Incorporate realistic slippage models during training to simulate execution costs at scale.
Practical Integration with Existing Technical Analysis Dashboards
Integrating RL outputs into platforms like TradingView or custom dashboards requires exporting action probabilities and confidence scores through REST APIs. Developers can create custom indicators that display suggested position sizes alongside traditional charts. This hybrid approach lets analysts retain familiar tools while benefiting from adaptive decision logic. Testing in sandbox environments before live deployment helps identify integration bugs related to data synchronization or API rate limits.
FAQ: Integrating RL Models into Technical Analysis Dashboards
How do I add RL signals to an existing charting platform? Export policy outputs as probability distributions and overlay them as additional indicators via API connectors.
What hardware is required for training? Cloud GPU instances with at least 16 GB VRAM handle most equity-universe environments efficiently.
Can RL replace traditional technical analysis? No—RL augments TA by providing adaptive action recommendations on top of familiar indicator readings.
How often should the model be retrained? Daily incremental updates combined with monthly full retraining maintain performance across shifting regimes.
What data sources work best for sentiment features? Combine news APIs with social media aggregators and earnings call transcripts for comprehensive coverage.
How do I handle regulatory compliance? Log all model decisions and maintain audit trails to satisfy requirements from bodies such as the U.S. Securities and Exchange Commission.
Conclusion
Reinforcement learning delivers a forward-looking framework for navigating 2026 market dynamics. By grounding reward functions in risk-adjusted metrics, enriching state spaces with proven indicators, and maintaining rigorous training pipelines, traders can build agents that adapt faster than conventional models. Careful attention to overfitting, latency, and integration details ensures these systems enhance rather than disrupt established technical analysis workflows, ultimately improving entry timing and portfolio resilience.
No comments yet. Be the first!