 Bullish Portfolio
Introduction to Cumulative Delta in Modern Trading
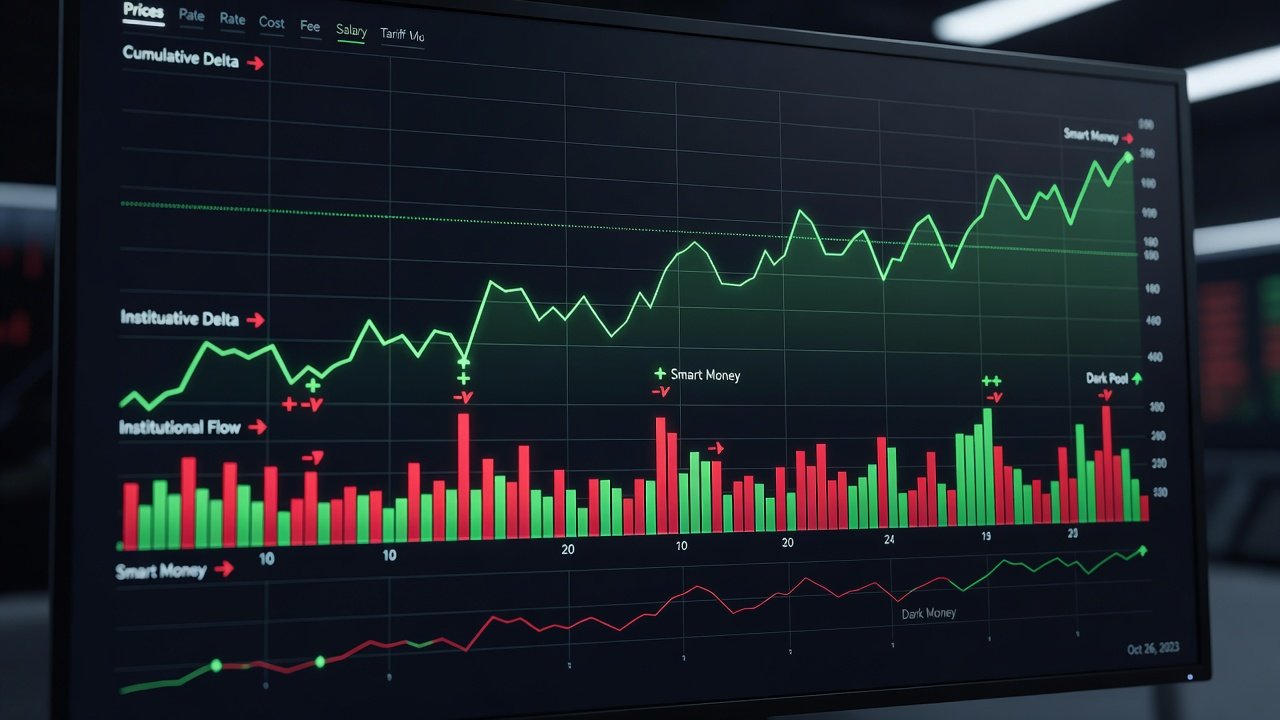
Traders seeking an edge in 2026 markets increasingly turn to cumulative delta strategies to identify institutional flow before price reversals occur. Cumulative delta measures the net difference between buying and selling volume at each price level, revealing where large players are accumulating or distributing positions. When combined with volume clusters, these tools highlight absorption, exhaustion, and divergence patterns that often precede major moves in indices like the S&P 500 or Nasdaq. This approach goes beyond traditional volume analysis by focusing on order flow imbalances that institutional participants leave through aggressive buying or selling. Retail traders equipped with the right setup can detect these footprints early and position themselves ahead of broader market moves. In volatile 2026 environments driven by algorithmic trading and macroeconomic events, understanding cumulative delta provides a measurable advantage over lagging indicators alone.
Understanding Cumulative Delta and Volume Clusters
Cumulative delta tracks the running total of delta (buy volume minus sell volume) over a session or custom period. Positive cumulative delta suggests dominant buying pressure, while negative values indicate selling dominance. Volume clusters appear as horizontal bands where significant trading activity occurred, often acting as support or resistance zones. In 2026, with increased algorithmic participation, these clusters frequently align with dark pool activity and institutional execution points. Traders monitor how price interacts with these levels to anticipate breakouts or reversals. For example, a cluster forming near a previous high can signal heavy institutional interest that may cap upside moves until absorption completes. By studying the relationship between delta direction and cluster density, traders gain insight into whether moves are supported by real order flow or merely retail-driven noise.
Key Signals: Absorption, Exhaustion, and Divergence
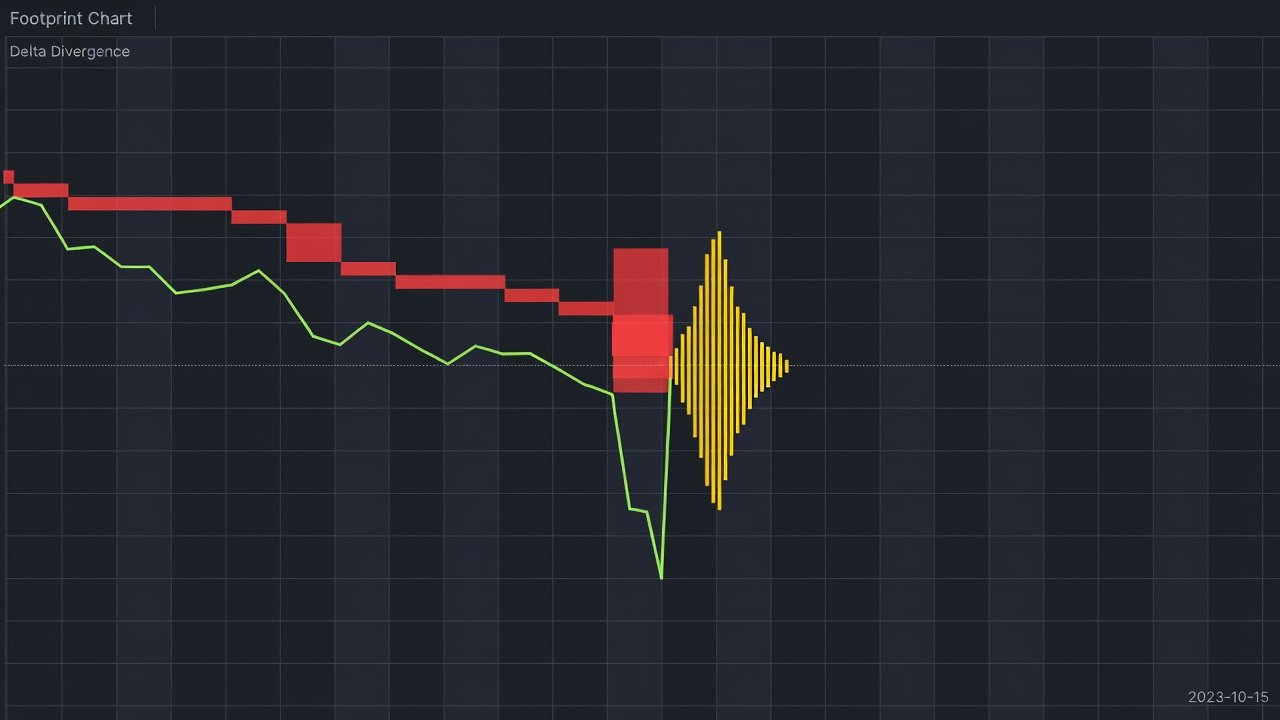
Absorption occurs when aggressive orders are met with opposing limit orders, flattening delta despite price movement. This signals smart money absorbing supply or demand without allowing price to advance quickly. Exhaustion appears as delta peaks that fail to push price further, indicating fading momentum from one side. Divergence arises when cumulative delta moves opposite to price, warning of potential reversals. Live chart examples from the Dow Jones Industrial Average often show these patterns during earnings seasons or FOMC announcements. Recognizing them early allows traders to position ahead of retail flows. Traders should watch for absorption at key volume cluster levels, as this frequently marks the start of sustained institutional campaigns rather than short-term noise.
Step-by-Step Setup of Order Flow Tools
Begin by selecting a platform supporting footprint charts and delta divergence indicators. Configure the cumulative delta line alongside volume profile. Set alerts for delta divergences exceeding two standard deviations from the mean. Integrate real-time data feeds from major exchanges to ensure accuracy during high-volatility periods. Next, calibrate your chart timeframes to match your trading style, starting with 5-minute and 15-minute footprints for intraday analysis. Add filters for minimum trade size to focus on institutional-sized orders. Test the setup on historical data from the previous quarter to confirm signal reliability before going live. Finally, integrate news overlays so macroeconomic releases appear directly on the delta chart, helping distinguish order flow signals from event-driven spikes.
Integration with Existing Technical Indicators
Combine cumulative delta with moving averages and RSI for confirmation. For instance, a bullish delta divergence coinciding with RSI oversold conditions strengthens entry signals. Avoid relying solely on order flow; use it as a filter within a broader technical framework. Traders can also layer Bollinger Bands to identify when price reaches extreme deviations while delta shows building pressure. This multi-indicator approach reduces false positives and improves timing. In practice, many professionals wait for price to close above a key moving average after a delta absorption signal before entering long positions.
Delta-Based Entries Versus Classic Volume Analysis
Classic volume analysis relies on total bars, missing directional intent. Delta-based methods reveal buyer-seller aggression directly. Resources from Investopedia highlight how order flow tools reduce lag compared to lagging volume indicators. In practice, delta entries often trigger 5-15 minutes earlier than volume spikes alone. Additionally, comparing the two methods side-by-side on the same chart reveals that cumulative delta provides clearer context during low-volume sessions when traditional volume bars appear ambiguous. This edge becomes especially valuable in 2026 markets where institutional algorithms execute in smaller increments across multiple venues.
Position-Sizing Rules for Risk Management
Allocate position size based on delta strength at key levels. Strong absorption at support warrants larger entries, while weak signals require smaller sizes. Maintain a maximum risk of 1-2% of capital per trade, adjusting for volatility measured by average true range. Advanced traders often scale into positions gradually as delta confirms continuation, reducing initial exposure. Always define exit targets in advance using the next major volume cluster as a profit objective. This disciplined approach prevents overexposure during periods of conflicting signals.
Checklist for Avoiding False Signals
- Confirm signals across multiple timeframes
- Check for news events that could override order flow
- Ensure volume clusters align with recent highs or lows
- Validate divergence with at least 20% delta imbalance
- Review historical performance on similar setups
- Ignore signals during the first and last 15 minutes of the session when noise is highest
- Cross-reference with futures delta for broader market context
Mistakes to Avoid When Using Cumulative Delta
One common mistake is entering trades solely on delta divergence without price confirmation. Another is ignoring the broader market context, such as overnight gaps or sector rotations. Traders should also avoid over-optimizing indicator settings on past data, which leads to curve-fitting. Instead, focus on consistent rules and forward-testing new variations on out-of-sample periods. Finally, do not chase every cluster; only those that coincide with institutional-sized delta shifts deserve attention.
Practical Case Studies from Major Indices
In early 2026 Nasdaq trading, cumulative delta revealed absorption near 18,000 support before a 3% rally. Similarly, S&P 500 exhaustion patterns preceded a pullback after FOMC minutes. These examples demonstrate how volume cluster confluence improves accuracy. Another case involved the Russell 2000 where divergence between price highs and declining cumulative delta accurately predicted a two-day correction. Traders who combined these signals with RSI confirmation achieved higher win rates than those using volume bars alone. Reviewing such real-world instances helps internalize the patterns and build confidence in live trading.
Further reading on market structure and order flow is available from authoritative sources including CME Group, SEC resources, and Federal Reserve publications on financial market dynamics.
Conclusion
Cumulative delta strategies provide a powerful lens for 2026 institutional flow detection when applied systematically. By mastering absorption, exhaustion, and divergence alongside proper risk rules, traders gain a measurable advantage in identifying smart money activity ahead of price moves.
FAQ
How reliable are delta signals during low-volume periods? They require higher confirmation thresholds to avoid noise and should be paired with volume cluster alignment.
Can beginners use these tools effectively? Start with paper trading and focus on one index first, gradually adding complexity as familiarity grows.
What platforms support advanced cumulative delta? Popular choices include Sierra Chart and Bookmap with appropriate data subscriptions for real-time accuracy.
How often should traders review historical setups? Weekly reviews of the previous five trading sessions help refine pattern recognition without over-optimization.


No comments yet. Be the first!