 Bullish Portfolio

Introduction to Liquidity Microstructure in 2026 Markets
In 2026, technical traders face increasingly sophisticated markets where traditional price and volume signals can mislead without considering underlying liquidity dynamics. Microstructure elements such as bid-ask spreads, order-book depth, and hidden liquidity directly shape the reliability of moving averages, volume profiles, and breakout patterns. This article explores these interactions in depth, providing actionable frameworks to refine entries and avoid costly false signals. Understanding microstructure helps traders interpret why certain technical setups succeed or fail, especially during high-volatility periods. By layering liquidity data onto classic indicators, professionals gain an edge in execution timing and risk management. Markets have evolved with faster algorithmic participation and regulatory changes that emphasize transparency in order flow, making liquidity awareness essential for consistent performance across equities and indices.
Key Microstructure Components Affecting Technical Analysis
Bid-Ask Spreads and Their Impact on Signals
Bid-ask spreads represent the immediate cost of trading and widen during periods of uncertainty or low participation. Narrow spreads support clean trend-following signals from moving averages, while wide spreads often distort short-term momentum readings and inflate perceived volatility. Traders should monitor intraday spread fluctuations to determine whether a moving average crossover reflects genuine momentum or simply compensation for elevated transaction costs.
Order-Book Depth and Volume Profiles
Order-book depth reveals the concentration of buy and sell interest at various price levels. When depth thins near key moving average levels, technical breakouts become vulnerable to rapid reversals. Volume profiles complement this by showing historical acceptance zones where liquidity clusters form, allowing traders to anticipate support and resistance with greater precision than price action alone provides.
Hidden Liquidity and Iceberg Orders
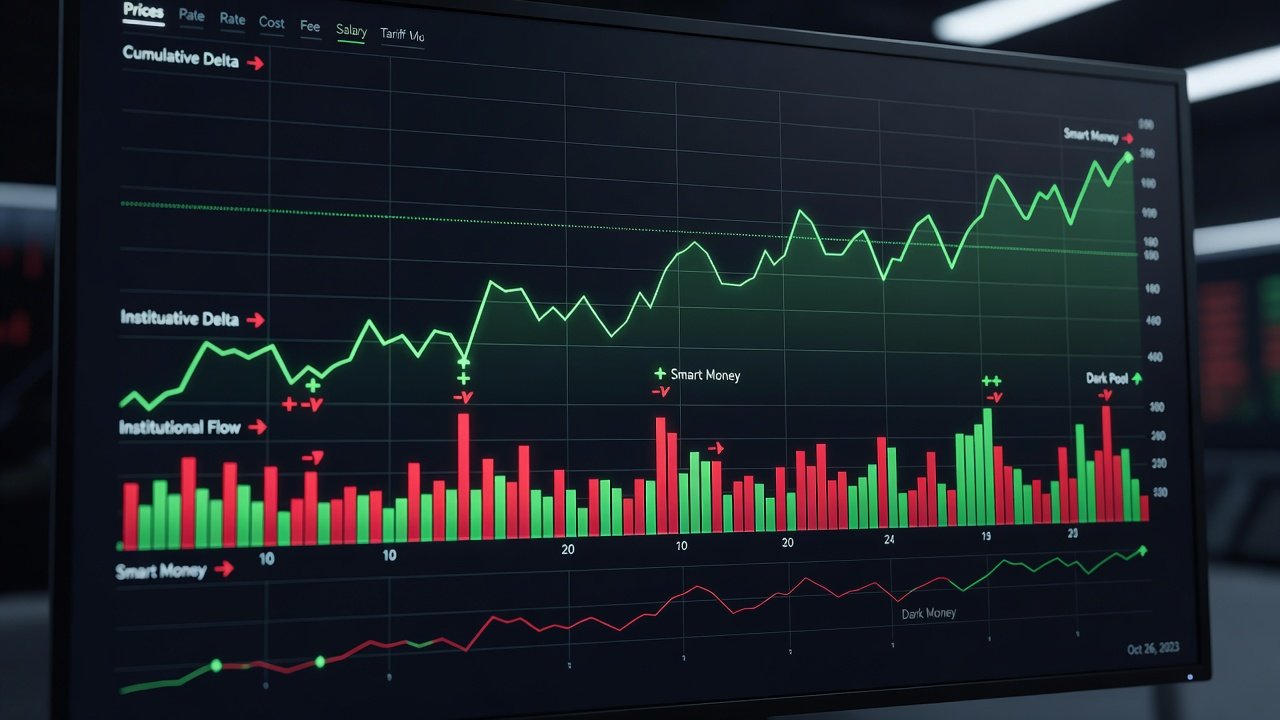
Hidden liquidity, often executed via iceberg orders or dark pools, masks true supply and demand. This concealment frequently creates the illusion of strong momentum on visible charts, leading to false breakouts that technical traders must learn to filter. Recognizing patterns where displayed depth fails to match executed volume helps prevent entries that quickly reverse once hidden orders are revealed.
Integrating Microstructure Data with Moving Averages: Step-by-Step
- Obtain tick-level data from authorized providers and calculate the effective spread using the formula: Effective Spread = 2 * |Trade Price - Midpoint|.
- Overlay a 20-period and 50-period simple moving average on the price chart while plotting real-time depth imbalance.
- Confirm any moving average crossover only when order-book depth exceeds a threshold of 1.5 times the average depth observed over the prior 20 sessions.
- Adjust entry filters to require hidden liquidity estimates below 30% of visible depth to reduce slippage risk.
- Backtest the combined rules on at least six months of historical tick data to validate performance across different market regimes.
This process transforms standard moving average strategies into liquidity-aware systems that respect current market conditions. Additional refinement involves weighting recent depth data more heavily during earnings seasons when participation patterns shift abruptly.
Using Volume Profiles with Microstructure Filters
Volume profiles identify high-volume nodes where price tends to consolidate. Combine these nodes with order-book imbalance metrics: enter long positions only when a profile node aligns with heavy bid depth and narrow spreads. This dual confirmation reduces the frequency of entries during thin markets prone to erratic swings. Traders can further enhance the approach by segmenting profiles into visible versus dark-pool components, revealing where institutional activity may be concentrated away from public view.
Real Index Examples: Avoiding False Breakouts
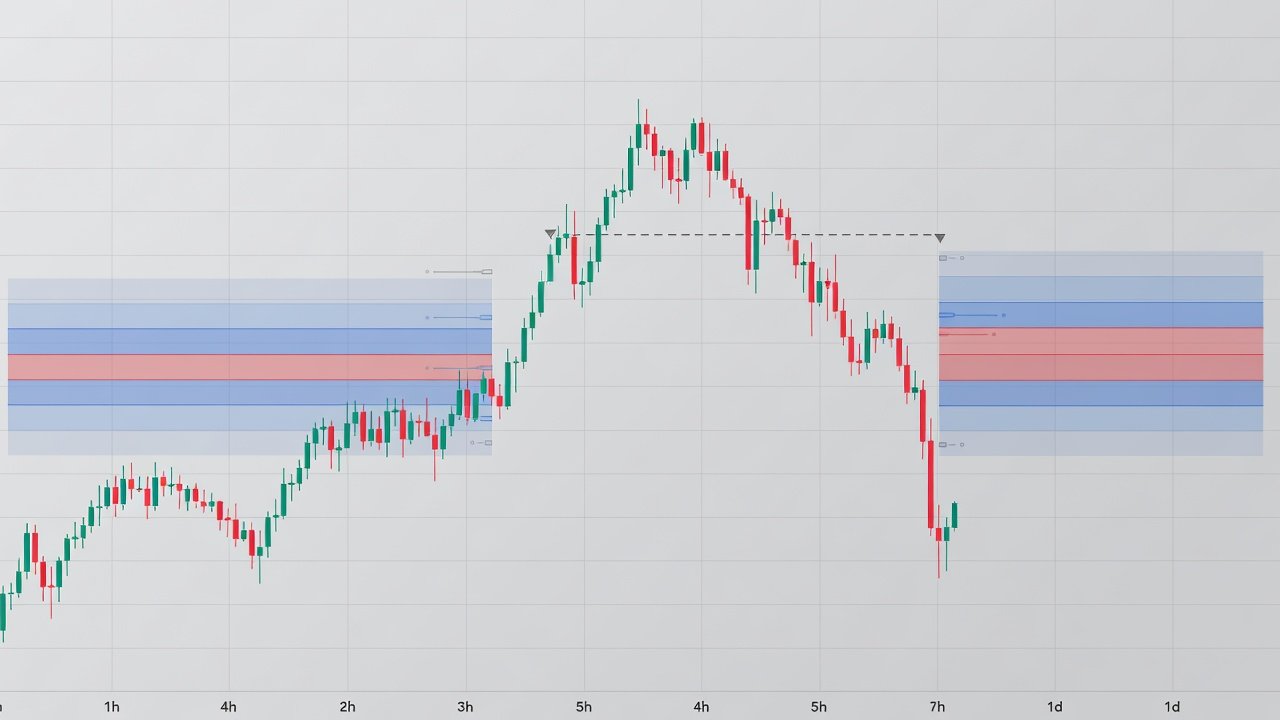
Consider the S&P 500 during a March 2026 session where the index appeared to break above its 50-day moving average on rising volume. However, order-book depth at the breakout level was only 40% of the session average, and effective spreads had widened to 12 basis points. Traders applying microstructure filters avoided the subsequent 1.8% reversal within two hours. Similar patterns appeared in the Nasdaq-100, where hidden liquidity absorption at resistance levels repeatedly invalidated apparent breakouts visible on standard charts. In another instance involving the Russell 2000, a seemingly strong volume spike near a key moving average coincided with depleted ask depth, resulting in a rapid pullback that filtered signals would have correctly bypassed.
Practical Tools for Sourcing Tick Data and Calculating Spreads
Reputable sources include exchange-provided APIs and aggregated platforms compliant with regulatory standards. Calculate effective spreads in real time by comparing trade prices against prevailing midpoints. Many platforms now offer pre-built microstructure dashboards that export depth metrics directly into charting software for seamless integration with volume profiles. When selecting tools, prioritize those offering millisecond timestamp accuracy and historical replay capabilities so traders can simulate filtered entries under realistic liquidity conditions.
Setting Entry Filters Based on Liquidity Metrics
Effective entry filters combine multiple microstructure variables into a single score. For example, require the effective spread to remain below its 20-session median while order-book imbalance favors the trade direction. These filters prove especially valuable during low-volume periods such as holiday weeks or overnight sessions when technical signals alone produce excessive whipsaws.
Comparison: High-Liquidity vs Low-Liquidity Names
| Metric | High-Liquidity Example (AAPL) | Low-Liquidity Example (Small-Cap Stock) |
|---|---|---|
| Average Effective Spread (as of 2026-10-01) | 1-2 basis points | 25-40 basis points |
| Typical Order-Book Depth | Deep, stable | Thin, volatile |
| False Breakout Frequency | Low when depth confirmed | High without filters |
| Recommended TA Filter | Standard moving averages | Depth + spread confirmation required |
FAQs on Execution Slippage During Trend Moves
How does hidden liquidity contribute to slippage?
Hidden orders can absorb visible volume without altering displayed depth, causing executed prices to move beyond intended levels once the iceberg is revealed.
What slippage levels are typical in trending markets?
In liquid names, slippage remains minimal during established trends; in thinner names, even strong trends can produce 5-15 basis point deviations without proper filters.
Can volume profiles alone prevent slippage?
Volume profiles provide context but must be paired with live depth and spread data for reliable protection against adverse execution.
How often should traders recalibrate liquidity thresholds?
Recalibration every 20 trading sessions balances responsiveness to regime shifts with avoidance of overfitting to short-term noise.
Mini Daily Microstructure Checklist Before Acting on TA Setups
- Review average effective spread over the last 30 minutes and confirm it is within normal range for the symbol.
- Check order-book depth at the proposed entry level versus the 20-session average.
- Estimate hidden liquidity percentage using available dark-pool indicators.
- Validate alignment between volume profile nodes and current depth imbalance.
- Apply entry filter requiring depth confirmation before executing any moving-average or breakout signal.
- Document any deviations from checklist rules to refine future performance reviews.
Conclusion
Mastering 2026 liquidity dynamics elevates technical trading from reactive pattern recognition to informed, microstructure-validated decision making. By consistently applying the methods, tools, and checklists outlined above, traders can significantly reduce false signals and improve execution quality across diverse market conditions. For further authoritative guidance on market structure, consult resources from U.S. Securities and Exchange Commission, NYSE, and Federal Reserve.
No comments yet. Be the first!