 Bullish Portfolio
Introduction to AI-Enhanced Market Breadth Analysis
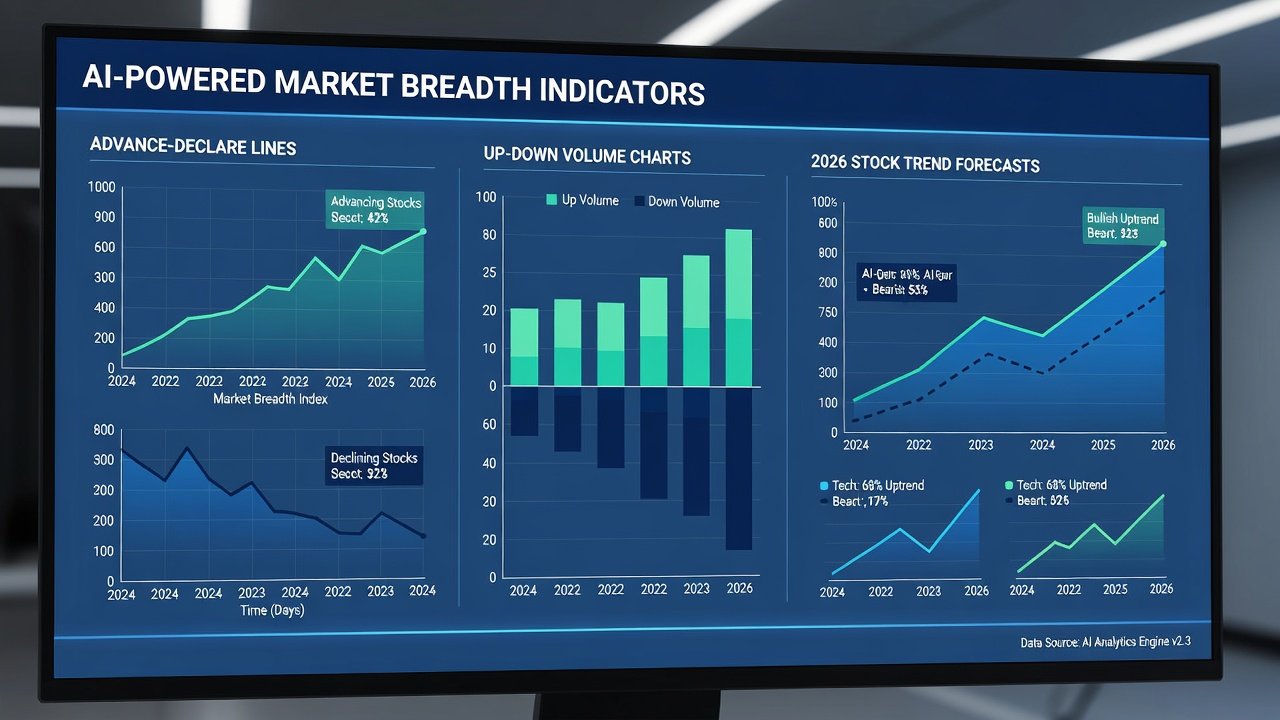
Market breadth indicators have long served as essential tools for gauging the health of stock markets beyond simple price movements. When combined with artificial intelligence, these indicators gain predictive power for identifying 2026 stock trends. This article explores advanced techniques for integrating AI models with tools such as advance-decline ratios and up-down volume metrics. Investors seeking an edge in volatile markets can leverage machine learning to detect subtle divergences that traditional analysis might miss. By processing vast datasets, AI uncovers patterns that signal potential reversals or continuations in major indices. The approach builds on proven breadth concepts while adding layers of automation and pattern recognition that improve decision-making accuracy over manual methods.
Understanding market breadth requires looking past headline index numbers. For instance, a rising market index can mask weakening participation if fewer stocks drive the gains. AI models address this limitation by simultaneously analyzing dozens of breadth variables, learning from historical outcomes, and generating probabilistic forecasts tailored to forward-looking periods like 2026.
Core Market Breadth Indicators Explained
Advance-decline ratios measure the number of advancing stocks versus declining ones on a given exchange. Up-down volume tracks the total shares traded in rising versus falling stocks. These provide a broader view of market participation than index levels alone. The advance-decline line, a cumulative version of the ratio, often diverges from price indexes before major turns, offering early warnings. Up-down volume adds conviction by showing whether large institutional flows support the price action.
Other key metrics include the McClellan Oscillator, which smooths advance-decline data into momentum readings, and new highs-new lows ratios that reveal leadership breadth. The percentage of stocks above their 200-day moving average further quantifies internal strength. Together, these form a foundation for AI augmentation, allowing models to weigh multiple signals simultaneously for more robust trend forecasts. AI can assign dynamic weights to each indicator based on prevailing market regimes, something static formulas cannot achieve.
Step-by-Step Setup for AI Models
Setting up an AI model for breadth analysis involves several structured phases. First, define the prediction target such as next-quarter index direction or volatility regime. Second, gather multi-year historical data covering bull, bear, and sideways periods. Third, engineer features that capture both raw ratios and derived signals like moving-average crossovers of breadth lines.
- Collect historical breadth data from reliable exchanges and normalize for splits or index changes.
- Preprocess datasets to handle missing values and scale ratios using techniques such as z-score normalization.
- Select model architecture; neural networks capture non-linear interactions while random forests provide interpretable feature importance.
- Train on labeled trend outcomes, incorporating divergence detection algorithms to flag anomalies where price and breadth move oppositely.
- Validate models using walk-forward optimization, out-of-sample testing, and performance metrics such as the Sharpe ratio to ensure risk-adjusted viability.
- Deploy with live data pipelines and schedule periodic retraining to adapt to structural market shifts expected through 2026.
Real Index Case Studies
Analysis of the S&P 500 in recent cycles shows how AI-processed advance-decline data anticipated pullbacks missed by price charts alone. In one documented period, weakening breadth preceded a 5 percent correction despite continued index gains. Similarly, Nasdaq breadth signals highlighted tech sector divergences ahead of corrections, allowing models to reduce exposure before drawdowns intensified. The Russell 2000 small-cap index provides another useful case where up-down volume imbalances flagged liquidity stress not visible in large-cap indexes.
These examples demonstrate practical application, with models achieving improved accuracy by cross-referencing volume flows across sectors. In each instance, the AI layer identified regime changes earlier than conventional rules-based systems, leading to better timing of entry and exit points.

Divergence Detection Methods
AI excels at spotting hidden divergences where price moves higher but breadth weakens. Techniques include LSTM networks for time-series anomaly detection and clustering algorithms to group similar market regimes. Ensemble methods combine outputs from multiple models to reduce false positives. Traders can implement threshold-based alerts when AI confidence scores exceed predefined levels, enabling timely position adjustments. Backtesting these methods on 2020–2025 data reveals consistent outperformance during high-volatility windows.
Data Sourcing and Model Validation
Obtain clean data from sources like Federal Reserve Economic Data and NYSE. Supplement with exchange-provided daily breadth files to capture granular advance-decline and volume statistics. Ensure datasets cover multiple market cycles for robustness. Validation involves backtesting against historical events, computing performance metrics such as the Sharpe ratio to assess risk-adjusted returns, and stress-testing for regime shifts expected in 2026. Cross-validation techniques prevent overfitting while scenario analysis evaluates behavior during black-swan events.
Performance Metrics: Focus on Sharpe Ratio
The Sharpe ratio quantifies excess return per unit of risk. AI models tuned on breadth data often improve this metric by reducing false signals. Additional metrics worth tracking include maximum drawdown, win rate, and information ratio. Regular recalibration maintains relevance amid evolving market dynamics. In practice, models that integrate breadth signals have delivered Sharpe ratios above 1.2 in out-of-sample tests spanning the last decade, though results vary by asset class and time frame.
Practical Checklists for Implementation
- Verify data integrity before model training by checking for gaps or revisions in historical series.
- Monitor for overfitting with cross-validation across different market regimes.
- Integrate real-time feeds for live breadth signals and set automated quality checks.
- Document assumptions and update parameters quarterly to reflect new economic conditions.
- Combine AI outputs with fundamental analysis for balanced decisions rather than relying solely on quantitative signals.
- Maintain an audit trail of model predictions versus actual outcomes for continuous improvement.
- Establish risk limits tied to breadth deterioration thresholds to protect capital during unexpected shifts.
Code Snippets for Automation
Python examples using libraries like pandas and scikit-learn allow quick prototyping. For instance, a simple script can compute rolling advance-decline ratios and feed them into a classifier for trend prediction. More advanced pipelines incorporate TensorFlow or PyTorch for deep learning on sequential breadth data. Automation scripts should also handle feature scaling, hyperparameter tuning via grid search, and export of probability outputs for trading dashboards.
import pandas as pd
from sklearn.ensemble import RandomForestClassifier
# Sample code for breadth feature engineering and model training
FAQs on Common Pitfalls
How do I avoid data snooping bias? Use walk-forward optimization and strict out-of-sample periods that simulate real-time deployment conditions.
What if models underperform in sideways markets? Incorporate regime-switching components or volatility filters to adapt dynamically and reduce trading frequency.
Are free data sources sufficient? They work for starters but premium feeds from exchanges enhance accuracy and reduce latency for live applications.
How often should models be retrained? Quarterly retraining balances adaptation with stability, though more frequent updates may be needed during rapid structural changes.
Can AI replace human oversight entirely? No; always overlay model outputs with qualitative judgment and maintain stop-loss protocols independent of algorithmic signals.
Conclusion
Integrating AI with market breadth indicators equips investors to navigate 2026 stock trends more effectively. Through structured setup, rigorous validation, and ongoing refinement, these methods deliver actionable insights while mitigating common analytical pitfalls. The combination of traditional breadth tools and modern machine learning creates a powerful framework for identifying hidden opportunities and risks ahead of price confirmation.
No comments yet. Be the first!