 Bullish Portfolio
Introduction to Liquidity Metrics in 2026 Markets
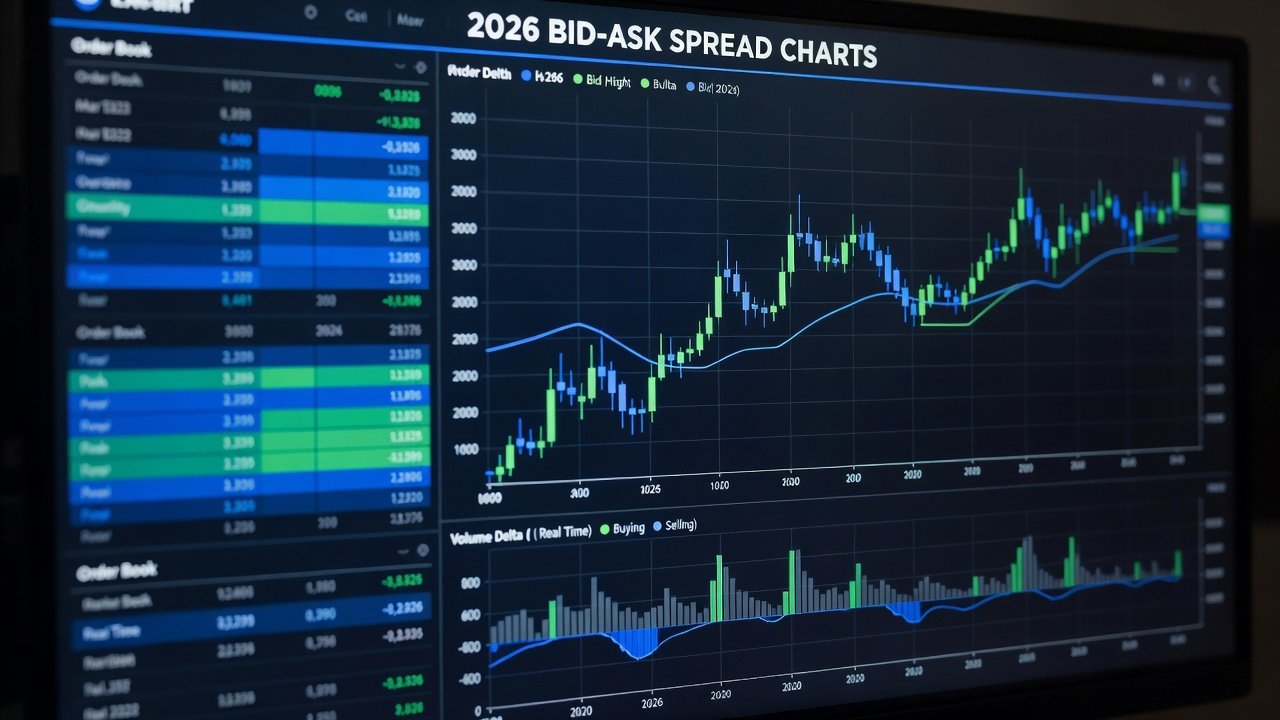
Stock traders in 2026 face increasingly complex environments where liquidity signals reveal institutional footprints before price moves accelerate. Bid-ask spreads, market depth, and volume delta form the core of advanced liquidity analysis, helping identify smart money participation across volatile sectors. This guide breaks down calculations with practical examples and shows how to integrate these tools into daily decision-making for improved entry and exit timing.
Liquidity analysis has evolved significantly with the rise of algorithmic trading and high-frequency participants. Understanding these metrics allows retail traders to align with larger players rather than fight against them. In practice, monitoring these indicators in real time can highlight accumulation phases that precede major breakouts or distribution ahead of reversals.
Understanding Bid-Ask Spreads
The bid-ask spread measures the difference between the highest price a buyer will pay and the lowest price a seller will accept. Narrow spreads indicate high liquidity, while widening spreads often signal institutional accumulation or distribution. In 2026, traders monitor real-time spread changes on platforms to gauge order flow pressure across different market conditions.
Types of Spreads and Their Implications
Quoted spreads represent the visible difference in the order book, while effective spreads account for actual executed prices including any price improvement or slippage. Realized spreads further adjust for post-trade price movements. Institutional traders frequently operate within the quoted spread using dark pools, which can leave visible book spreads artificially wide during stealth accumulation.
Step-by-Step Calculation of Effective Spread
1. Record the best bid and ask at the moment of a trade. 2. Calculate the midpoint as (bid + ask) / 2. 3. Subtract the midpoint from the trade price and double the result for the effective spread. 4. Compare across multiple trades to detect patterns of institutional flow. 5. Normalize the spread by the midpoint price to enable cross-stock comparisons. 6. Track spread volatility over rolling windows such as 15-minute or hourly periods.
Real 2026 market examples from tech and energy sectors demonstrate how spreads expand 15-30% ahead of major announcements, providing early warnings. For instance, a semiconductor stock might show a quoted spread of 0.05 widening to 0.08 during pre-earnings positioning by large funds.
Market Depth and Order Book Analysis
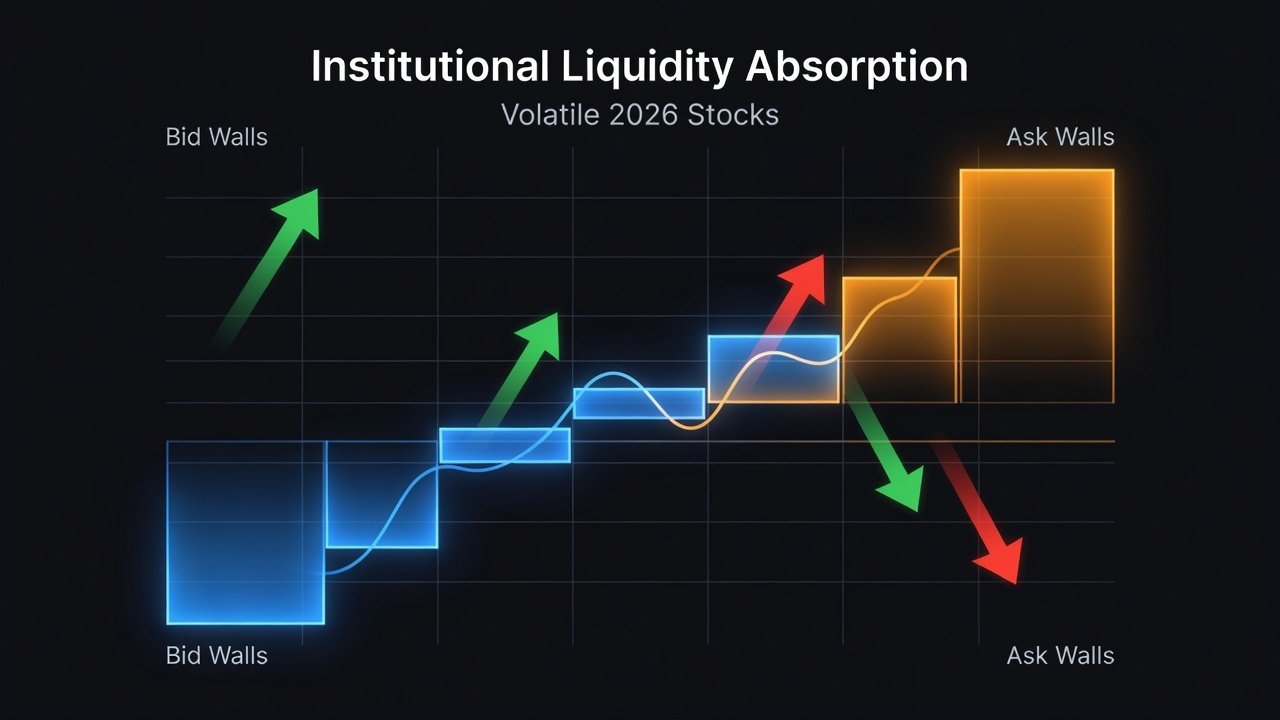
Market depth reveals the volume available at each price level in the order book. Institutional activity appears as large, hidden orders that absorb liquidity without immediate price impact. Depth charts help traders visualize support and resistance zones created by iceberg orders and layered bids or offers.
Interpreting Depth Imbalances
- Heavy bids stacked at support levels often precede upward moves driven by institutional buying.
- Thin asks on the offer side can trigger rapid price spikes when momentum builds.
- Track depth changes over 5-15 minute intervals for actionable signals.
- Monitor for sudden depth withdrawals that may indicate spoofing or genuine liquidity removal.
- Compare depth ratios between bid and ask sides to anticipate short-term directional bias.
Volume Delta: Quantifying Buying vs Selling Pressure
Volume delta calculates the difference between aggressive buy volume and aggressive sell volume. Positive delta shows buyers dominating at the ask, while negative delta highlights seller control at the bid. Cumulative delta plots over the session can reveal divergences from price action that often precede reversals.
Combine volume delta with bid-ask spread data to confirm institutional intent. For instance, tightening spreads paired with rising positive delta frequently mark the start of sustained trends in 2026 biotech and semiconductor names. Traders can also segment delta by trade size to isolate large-block activity typical of institutions.
Comparing Liquidity Signals Across Volatile Sectors
Energy stocks in 2026 often display wider baseline spreads due to geopolitical factors, making delta shifts more pronounced. In contrast, mega-cap tech exhibits tighter spreads but deeper order books that require larger institutional blocks to move prices. Traders should adjust thresholds by sector volatility rather than applying uniform rules. Healthcare and financials present intermediate profiles where liquidity can dry up quickly during news events.
Practical comparisons show that energy names may require spread alerts set at 25% above average, while tech names trigger at just 10% expansion. These sector-specific calibrations improve signal accuracy and reduce false positives.
Practical Risk Management Tips
Always size positions relative to average spread width to avoid slippage. Set alerts for sudden spread expansion exceeding 20% of the 30-day average. Use stop-losses placed beyond key depth levels to prevent premature exits during temporary liquidity droughts. Additionally, avoid trading during the first and last 15 minutes of the session when spreads are widest and depth is thinnest. Maintain a liquidity score for each watchlist symbol and reduce position size when scores deteriorate.
Common Pitfalls and How to Avoid Them
Many traders misinterpret widening spreads as immediate reversal signals without confirming with volume delta. Another frequent error is ignoring after-hours liquidity distortions that do not carry into the next session. Always cross-reference multiple timeframes before acting. Over-reliance on a single metric without context from the broader tape or news flow can also lead to poor decisions. Finally, failing to account for exchange-specific matching rules can distort perceived liquidity in certain instruments.
Combining Liquidity Metrics with Momentum Indicators
Pair bid-ask and delta analysis with RSI or MACD for higher probability setups. When liquidity signals align with momentum crossovers, the probability of continuation increases significantly. Backtests from early 2026 data support this multi-factor approach for both day and swing trading. For example, a positive delta spike coinciding with an RSI bounce above 50 and tightening spreads offers a high-conviction long entry with defined risk below the recent depth low.
Implementing Liquidity Dashboards for Daily Trading
Build or subscribe to dashboards that stream live spread, depth, and delta data. Customize alerts for sector-specific thresholds and review overnight changes before the open. Integrate these feeds with your existing charting platform to create a unified workflow. Daily review of pre-market liquidity profiles helps prioritize symbols with the strongest institutional footprints.
Conclusion
Mastering 2026 liquidity metrics through bid-ask spreads, market depth, and volume delta provides a decisive edge for stock traders seeking to follow institutional activity. By applying the step-by-step methods, sector comparisons, and risk controls outlined above, traders can build more robust strategies and avoid common traps. Consistent practice with these tools, combined with momentum confirmation, leads to clearer decision-making and improved outcomes over time.
FAQs
How often should I refresh liquidity data? Update every 1-5 minutes during active sessions for optimal responsiveness.
Can these metrics work in low-volume stocks? They remain useful but require wider tolerance bands and confirmation from multiple sessions.
What platforms support volume delta in 2026? Most professional trading terminals now include delta analytics as standard features.
How do I calibrate alerts for different market regimes? Use recent 20-day averages and adjust multipliers based on realized volatility.
For authoritative market structure guidance, consult resources from the U.S. Securities and Exchange Commission, the Federal Reserve, and FINRA.
These concepts form a core part of modern investment strategies for active traders.

No comments yet. Be the first!