 Bullish Portfolio
Pivot Points: 2026 Stock Support & Resistance
In the volatile world of stock trading, pivot points stand as timeless tools for identifying key support and resistance levels. As we look toward 2026, with economic uncertainties from geopolitical shifts, interest rate fluctuations, and tech sector booms, pivot points offer traders a data-driven edge. This comprehensive guide dives deep into pivot point calculations for daily, weekly, and monthly charts, explores proven trading strategies like R1/S1 bounces and breakouts, and provides step-by-step examples from the S&P 500 and Nasdaq in early 2026. Whether you're a day trader or swing trader, mastering these levels can unlock high-probability setups when combined with other technical analysis tools.
What Are Pivot Points and Why They Matter in 2026
Pivot points are technical indicators calculated from the previous period's high, low, and close prices. They generate a central pivot point (PP) and multiple support (S1, S2) and resistance (R1, R2) levels, helping traders anticipate price reversals or continuations. Originating from floor traders in the 1930s, pivot points remain relevant today due to their simplicity and self-fulfilling prophecy—many algorithms and institutions reference them.
For 2026, pivot points are especially crucial amid expected market trends: a potential S&P 500 push toward 6,000+ driven by AI advancements, Nasdaq volatility from Big Tech earnings, and broader rotations into value stocks. By plotting these levels, you can gauge intraday momentum, set stop-losses, and target profits with precision. For more on the fundamentals, check Investopedia's technical analysis resources.
Calculating Pivot Points: Daily, Weekly, and Monthly Formulas
Pivot point calculations are straightforward but vary by time frame. Use the standard formula, which is the most popular:
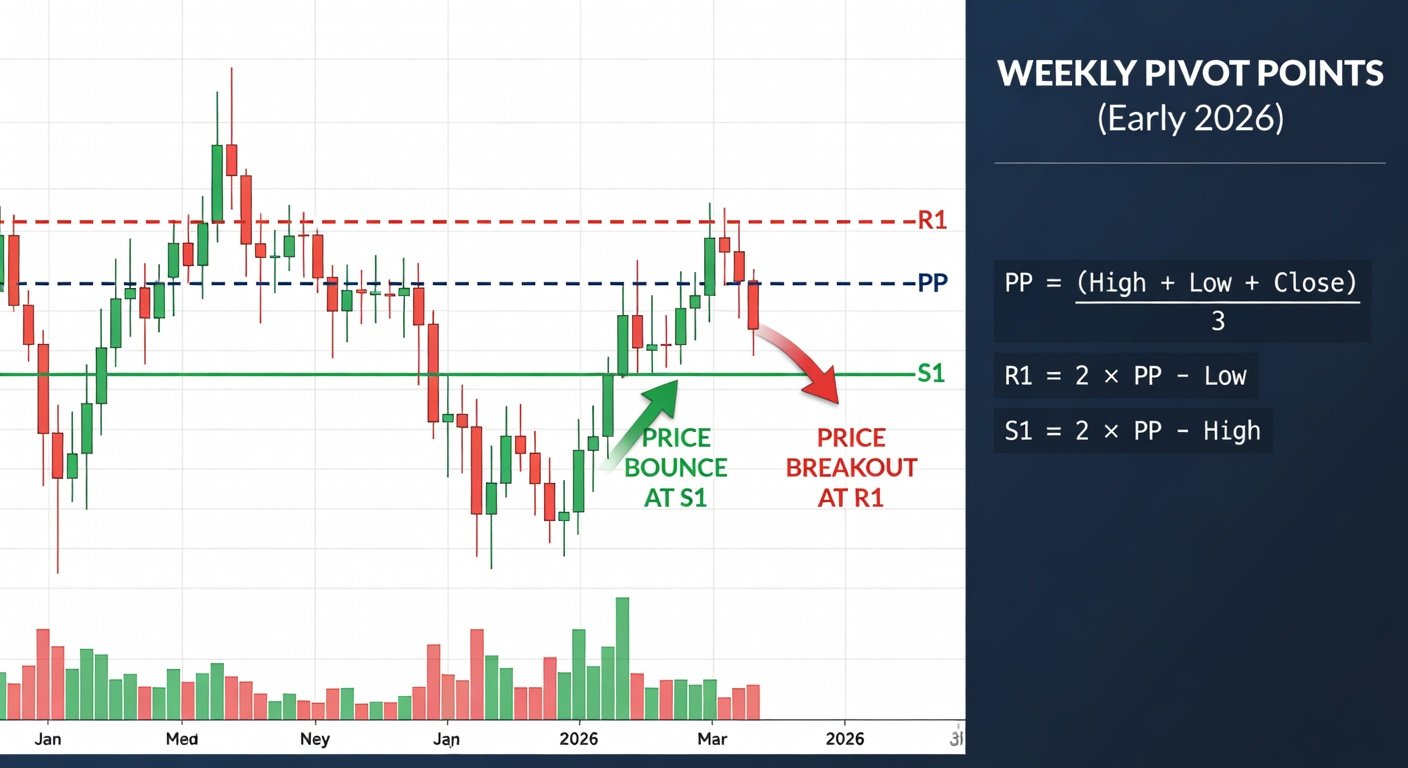
- Central Pivot Point (PP): (High + Low + Close) / 3
- First Resistance (R1): (2 x PP) - Low
- First Support (S1): (2 x PP) - High
- Second Resistance (R2): PP + (High - Low)
- Second Support (S2): PP - (High - Low)
- Third Levels (R3/S3): Extend further for extreme moves: R3 = High + 2(PP - Low); S3 = Low - 2(High - PP)
Daily Pivot Points
Ideal for day trading. Use the prior day's HLC data. Example: If a stock closes at $100, high $105, low $95:
- PP = (105 + 95 + 100)/3 = $100
- R1 = (2x100) - 95 = $105
- S1 = (2x100) - 105 = $95
Weekly Pivot Points
Suited for swing trades lasting days to weeks. Use Monday's open or prior week's HLC. These levels hold stronger due to higher time frame confluence.
Monthly Pivot Points
Best for position trading. Prior month's data provides major levels that align with institutional orders. In 2026, monthly pivots on indices like Nasdaq could signal quarterly trend shifts.
Pro Tip: Platforms like TradingView auto-plot these. Always verify with Nasdaq's charting tools for real-time accuracy.
Trading Strategies Using Pivot Points
Pivot points shine in range-bound and trending markets. Here are core strategies tailored for 2026 volatility.
1. R1/S1 Bounce Trades
Enter when price bounces off these first levels with confirmation (e.g., candlestick reversal).
- Wait for price to approach S1 from above or R1 from below.
- Confirm with volume spike or RSI divergence (below 30 for buys, above 70 for sells).
- Enter long/short at bounce; target PP or next level; stop below/above the pivot level.
Risk: False bounces in strong trends—use 1% account risk.
2. Pivot Point Breakout Trades
Trade momentum when price breaks R1/S1 with conviction.
- Price closes beyond R1/S1 on high volume.
- Enter on pullback to broken level (now support/resistance).
- Target R2/S2 or trail stops using ATR.
In breakouts, 2026's expected Fed rate cuts could fuel Nasdaq breakouts above monthly R1.
3. Range Trading Between Levels
Buy at S1/S2, sell at R1/R2 in sideways markets. Avoid during news events like FOMC meetings.
Real-World Examples: S&P 500 and Nasdaq in Early 2026
Let's apply this to hypothetical but realistic early 2026 data, based on projected trends (S&P at ~5,800, Nasdaq ~22,000 post-earnings rally).
S&P 500 Daily Pivot Example (Jan 15, 2026)
Prior day: High 5,850, Low 5,780, Close 5,820.
- PP = (5,850 + 5,780 + 5,820)/3 = 5,816.67
- R1 = (2x5,816.67) - 5,780 = 5,853.34
- S1 = (2x5,816.67) - 5,850 = 5,783
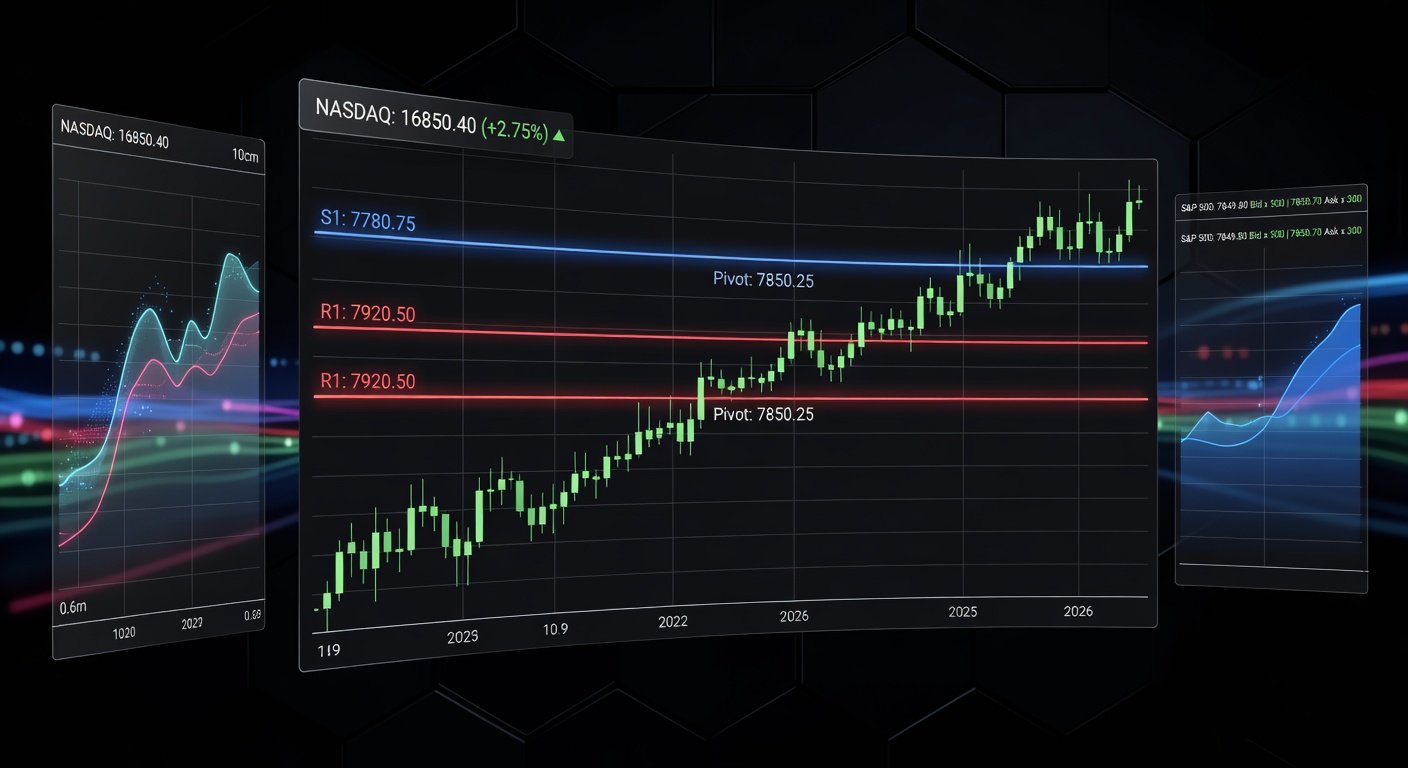
Nasdaq Weekly Pivot Example (Week of Jan 20, 2026)
Prior week: High 22,500, Low 21,800, Close 22,200.
- PP = 22,166.67
- R1 = 22,533.34
- S1 = 21,800
Advanced Tips: Combining Pivot Points with Other Tools
Elevate your edge by layering indicators:
- With Moving Averages: 50/200 SMA confluence at PP signals strong reversals.
- RSI/MACD: Oversold RSI (<30) at S1 = buy; MACD crossover at R1 breakout = go long.
- Volume Profile: High volume nodes near pivots confirm levels.
- Fibonacci: Align 61.8% retrace with S1 for precision entries.
- Multi-Time Frame: Daily R1 aligning with weekly PP = high-probability.
Mistakes to Avoid:
- Trading without confirmation—pivots alone fail in gaps.
- Ignoring fundamentals: 2026 elections could override technicals.
- Overleveraging: Use 1:2 risk-reward minimum.
FAQs on Pivot Points for 2026 Trading
Q: Are pivot points reliable in 2026's algo-driven markets?
A: Yes, as algos reference them too. Backtest on platforms like StockCharts.
Q: Best time frames for beginners?
A: Start with daily, graduate to weekly/monthly.
Q: Free tools for calculation?
A: TradingView, Thinkorswim, or Excel sheets.
Conclusion: Gear Up for 2026 with Pivot Mastery
Pivot points aren't crystal balls, but in 2026's dynamic markets, they provide structured support and resistance for smarter trades. Practice on paper, backtest S&P/Nasdaq setups, and integrate with your toolkit. Consistent application can boost win rates by 10-20%. Stay disciplined, manage risk, and let pivots guide your path to profitable trades.


No comments yet. Be the first!