 Bullish Portfolio
Introduction to Ichimoku Cloud in Modern Trading
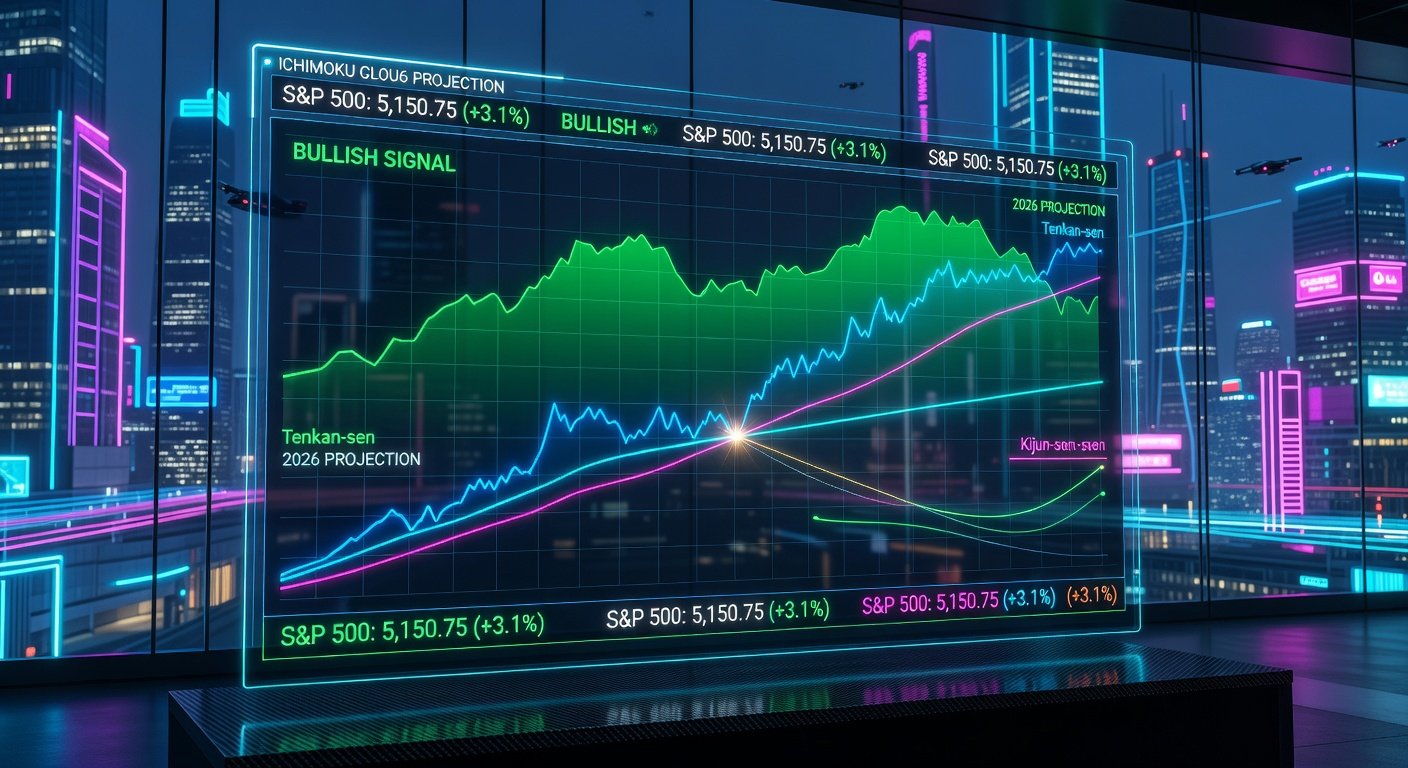
In the fast-evolving world of the 2026 stock market, where AI-driven algorithms and global events shape volatility, traders need robust tools for clarity. Enter the Ichimoku Cloud, a comprehensive Japanese technical indicator that provides a holistic view of market momentum, support, resistance, and trend direction. Developed by Goichi Hosoda in the late 1930s, it's more than just lines on a chart—it's a 'one-glance' equilibrium system perfect for spotting trends and reversals in major indices like the S&P 500, NASDAQ, and Dow Jones.
This guide dives deep into its components: Tenkan-sen, Kijun-sen, and the iconic 'cloud' (Kumo). We'll cover a step-by-step setup on popular platforms, interpretation strategies, and hypothetical 2026 case studies based on projected market behaviors. Whether you're a day trader or long-term investor, mastering Ichimoku can give you an edge in uncertain times.
Understanding the Core Components of Ichimoku Cloud
The Ichimoku system consists of five key lines, plotted ahead to forecast future price action. Here's a breakdown:
- Tenkan-sen (Conversion Line): A 9-period average of the highest high and lowest low. It signals short-term momentum, acting like a faster moving average.
- Kijun-sen (Base Line): A 26-period average, representing medium-term equilibrium. Crossovers between Tenkan and Kijun often signal buy/sell opportunities.
- Senkou Span A & B (Leading Spans): These form the 'cloud.' Span A is the midpoint of Tenkan and Kijun, plotted 26 periods ahead. Span B is a 52-period average, also shifted forward. The cloud's thickness indicates volatility—thicker clouds mean stronger support/resistance.
- Chikou Span (Lagging Span): Closing price plotted 26 periods behind, confirming trends by comparing past prices to current chart action.
A green cloud (Span A above Span B) signals bullish trends, while red (vice versa) indicates bearish. Price above the cloud is bullish; below is bearish. For deeper insights, check Investopedia's Ichimoku Cloud guide.
Step-by-Step Guide to Setting Up Ichimoku Cloud
Setting up Ichimoku is straightforward on platforms like TradingView or MetaTrader. Follow these steps:
- Open Your Charting Platform: Launch TradingView (tradingview.com) and select a major index like SPY (S&P 500 ETF) on a daily timeframe.
- Add the Indicator: Search for 'Ichimoku Cloud' in the indicators menu. Default settings are standard: 9, 26, 52 periods.
- Customize if Needed: For intraday trading in 2026's volatile markets, try 20, 60, 120 for crypto/stocks. Enable cloud transparency for clarity.
- Overlay on Price Chart: Ensure the cloud displays ahead of price for future projections.
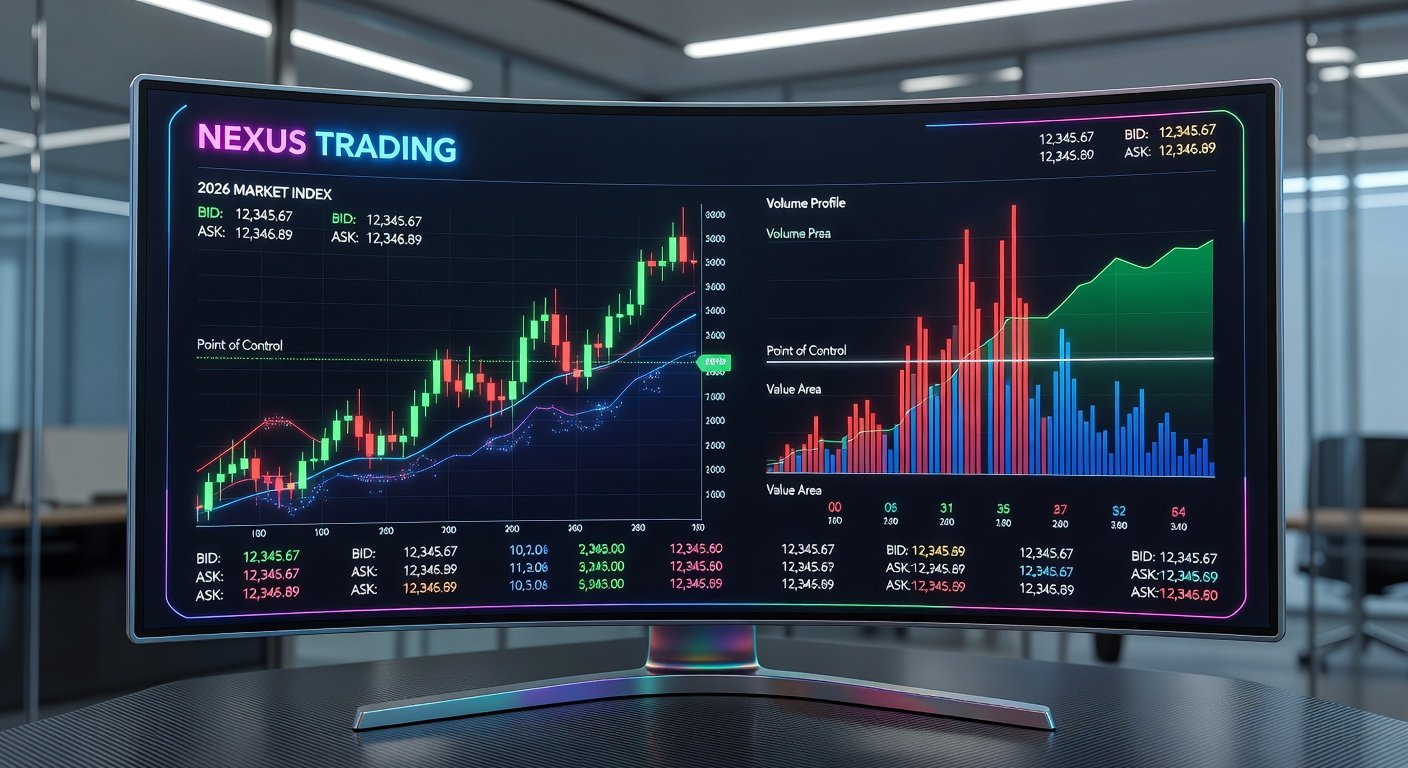
- Combine with Volume: Add volume oscillators to confirm signals.
Once set, scan for signals: Tenkan crossing above Kijun above the cloud is a strong buy. Practice on historical data before live 2026 trades.
Interpreting Ichimoku for Trends and Reversals
Ichimoku excels at multi-timeframe analysis. Key signals include:
Trend Identification
- Bullish Trend: Price above green cloud, Tenkan > Kijun, Chikou above price.
- Bearish Trend: Price below red cloud, Tenkan < Kijun, Chikou below price.
Reversal Signals
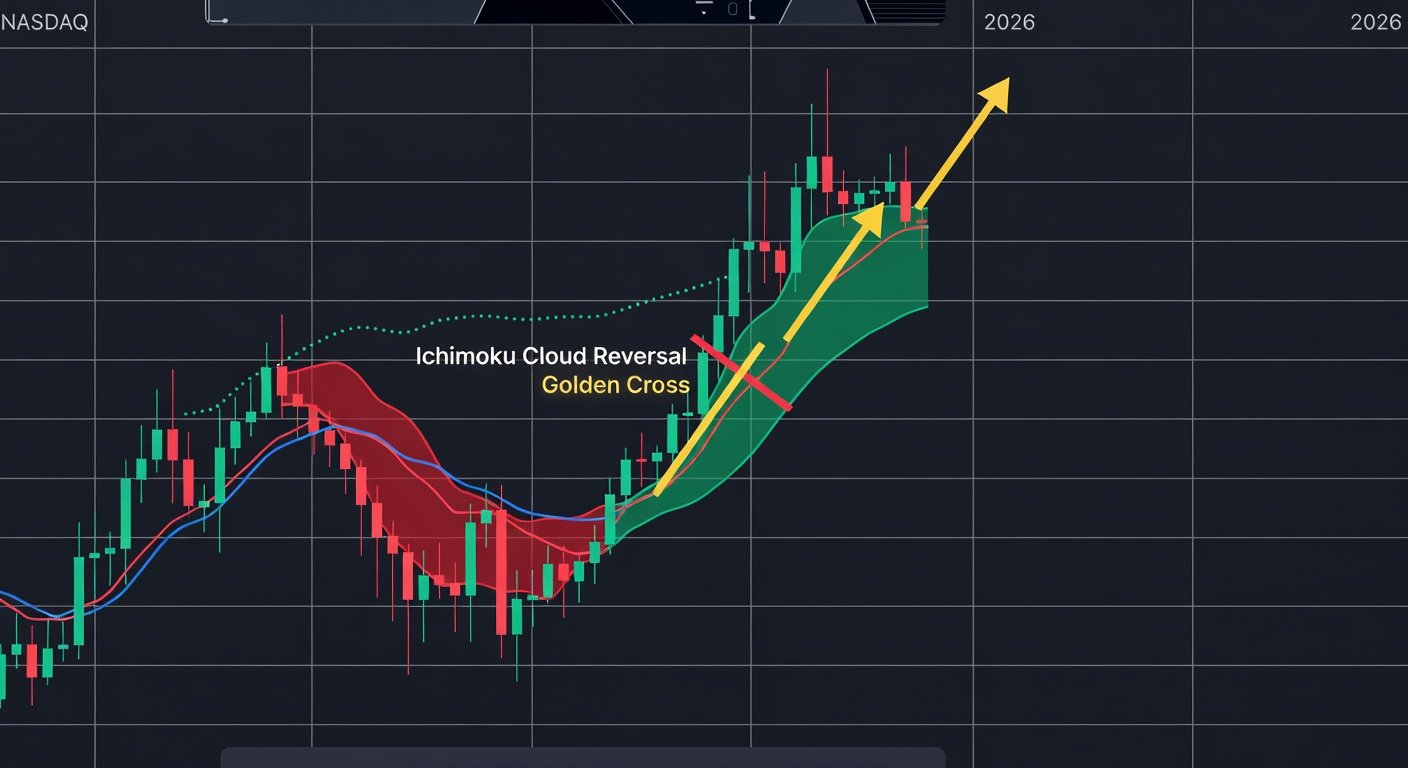
Watch for 'Kumo twists' where Span A crosses Span B, signaling potential shifts. A Tenkan/Kijun golden cross piercing the cloud from below screams bullish reversal. Use Chikou for confirmation—avoid false signals if it hits resistance.
In ranging markets, trade bounces off cloud edges. For 2026, with expected Fed rate cuts and AI boom, focus on cloud breaks during earnings seasons.
2026 Case Studies: Applying Ichimoku to Major Indices
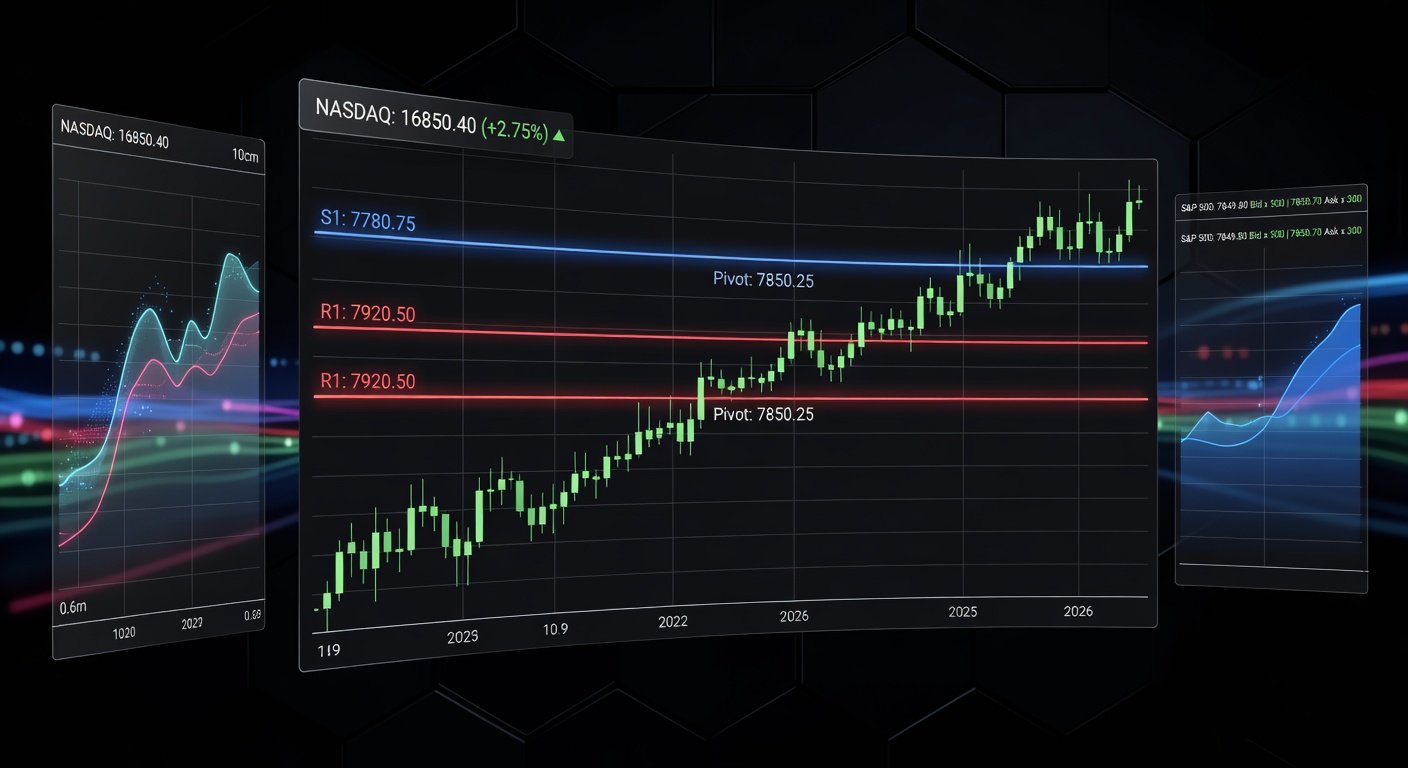
S&P 500 (SPX): Bullish Cloud Breakout
Imagine early 2026: Post-election clarity drives SPX to 6,200. Ichimoku shows price coiling below a thin red cloud. In Q1, Tenkan crosses Kijun upward, piercing the cloud—buy signal. By mid-year, SPX rallies 15% as Chikou clears prior highs. Traders entering at cloud support bank 20% gains, validated by NYSE data trends.
NASDAQ 100 (NDX): Reversal in Tech Pullback
Tech overvaluation hits in Q2 2026 amid China tensions. NDX drops to Kijun support within a green cloud. A bullish Kumo twist forms; price bounces with volume spike. Short-sellers cover as Chikou flips bullish, leading to a 12% rebound. This reversal highlights Ichimoku's strength in volatile sectors.
Dow Jones (DJIA): Bearish Cloud Rejection
Industrial stocks falter on supply chain woes. DJIA tests upper cloud resistance; Tenkan fails to cross Kijun downward. Instead, a death cross below thick red cloud confirms bear trend. Positions shorted here yield 10% by year-end, underscoring cloud's dynamic support role.
These cases assume moderate volatility; backtest on 2025 data for realism.
Advanced Tips for 2026 Ichimoku Trading
- Multi-timeframe: Use weekly for trend, daily for entries.
- Risk Management: Set stops below Kijun or cloud edge; target next cloud boundary.
- Filters: Pair with RSI (<30 oversold buy) or MACD for confluence.
- 2026 Nuances: Account for 24/7 crypto influence on stocks and algo-driven fakeouts.
Avoid trading thin clouds—whipsaws abound.
Conclusion: Elevate Your 2026 Trading with Ichimoku
The Ichimoku Cloud isn't just an indicator; it's a trading philosophy balancing past, present, and future. In 2026's market, where quantum computing meets geopolitics, its forward-looking clouds provide unmatched foresight. Start paper trading today, refine your setup, and watch trends unfold. Stay disciplined, and let Ichimoku guide your path to profitable reversals.
Complement Ichimoku with other proven investment strategies for better results.
No comments yet. Be the first!