 Bullish Portfolio
Introduction to Volume Profile in Modern Trading
Volume Profile is a powerhouse technical analysis tool that reveals where the real action happens in the markets. Unlike traditional volume bars at the chart's bottom, Volume Profile plots volume horizontally across price levels, highlighting high-volume nodes (HVNs) and low-volume nodes (LVNs). These zones act as hidden support and resistance, often more reliable than standard price-based levels.
In 2026, with volatile markets driven by AI stocks, renewable energy booms, and geopolitical shifts, traders are turning to Volume Profile for high-probability setups. This guide breaks down how to read Volume Profile charts, spot HVNs for 2026 trading opportunities, and fuse it with price action for entries that stack the odds in your favor.
What is Volume Profile and Why It Matters
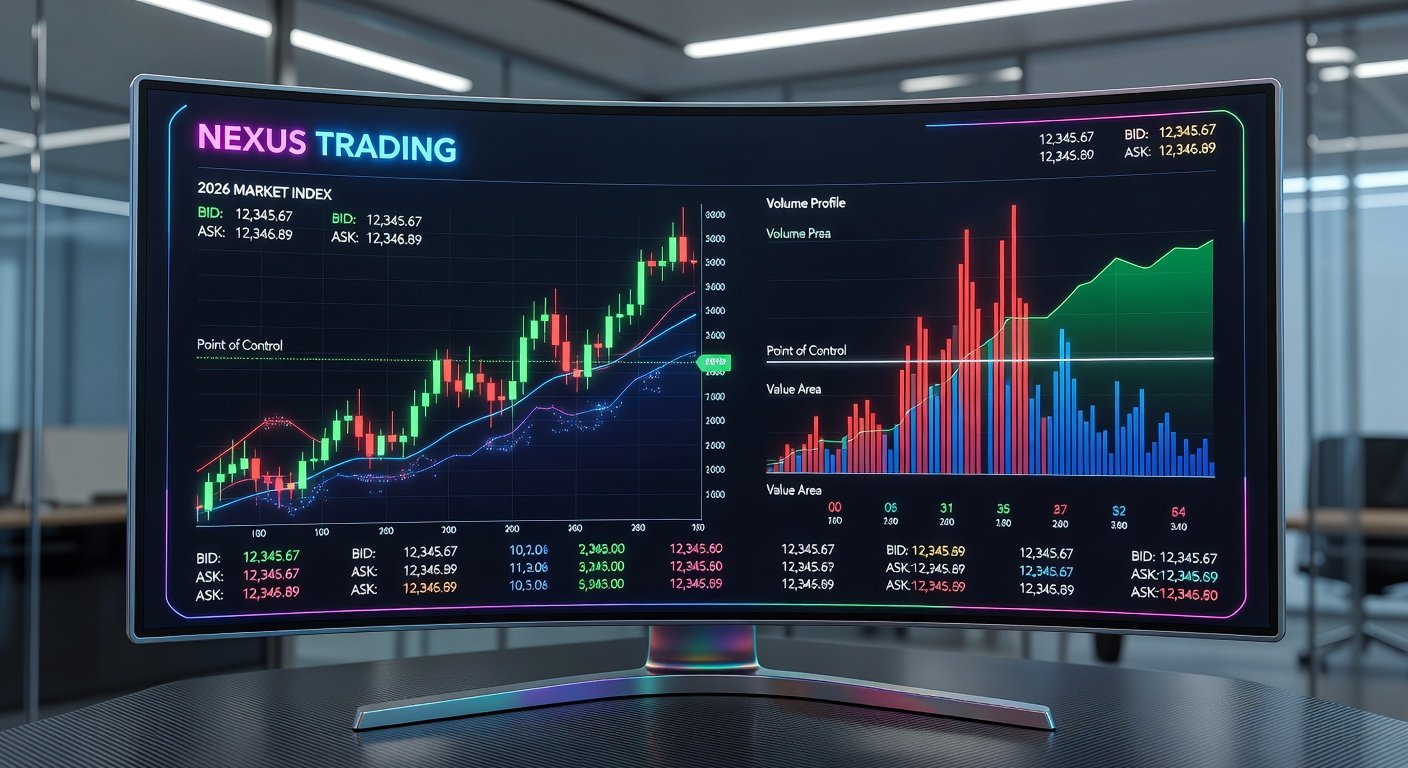
Volume Profile displays the amount of volume traded at each price level over a specific period, forming a bell-shaped curve or histogram on the side of your chart. Key components include:
- Point of Control (POC): The price with the highest volume, acting as a magnet for price.
- Value Area (VA): Where 70% of volume occurred, bounded by Value Area High (VAH) and Value Area Low (VAL).
- High-Volume Nodes (HVNs): Thick areas of high trading activity, strong support/resistance.
- Low-Volume Nodes (LVNs): Thin areas, where price moves quickly through.
For more on the basics, check out Investopedia's trading resources.
Step-by-Step: Reading Volume Profile Charts
Mastering Volume Profile starts with setup and interpretation. Here's your roadmap:
- Select Your Timeframe: Use session Volume Profile for intraday (e.g., RTH profile) or composite for multi-day views. In 2026, daily composites shine for swing trades.
- Identify the POC: Look for the longest bar in the profile—price gravitates here.
- Map Value Area: VAH/VAL form a 'fair value' zone. Price inside VA bounces; outside, it seeks value.
- Spot HVNs and LVNs: HVNs (bulges) are battlegrounds; LVNs (gaps) are acceleration zones.
- Analyze Profile Shape: P-shaped (bullish, volume at highs), b-shaped (bearish, volume at lows), or balanced (range-bound).
Practice on historical data to internalize these patterns.
Identifying High-Volume Nodes for 2026 Trading Setups
HVNs are goldmines for 2026, especially amid tech rallies and sector rotations. These nodes show where institutions accumulated or distributed, making them future pivot points.
Trading HVNs:
- Bullish Setup: Price rejects below HVN (support), then rallies through VAH.
- Bearish Setup: Price fails above HVN (resistance), drops to VAL.
- Breakout: LVN sweep followed by HVN test signals continuation.
In volatile 2026 markets, target HVNs from prior sessions for confluence. 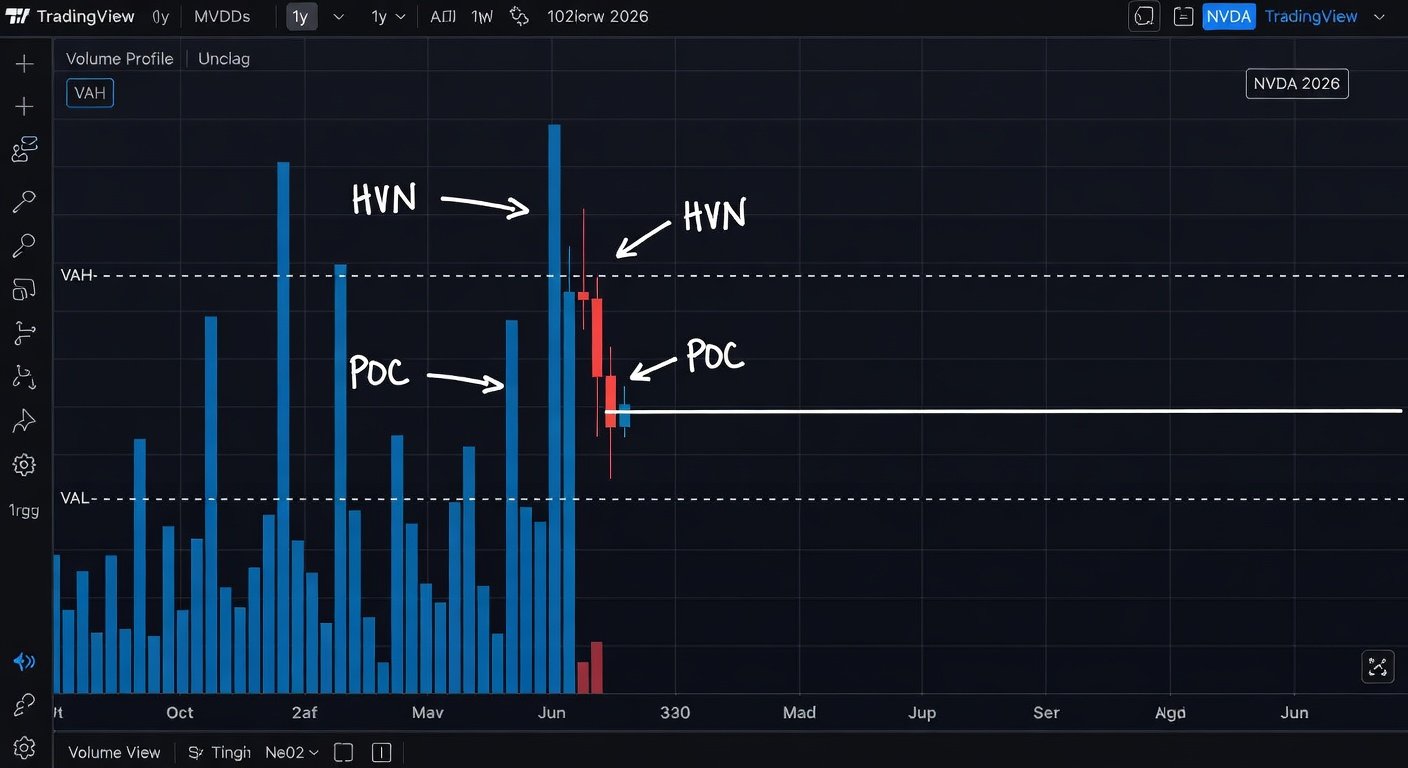
Combining Volume Profile with Price Action
Volume Profile alone is powerful, but pair it with price action for precision. Key combos:
- POC Bounce: Hammer/doji at POC + bullish engulfing = long entry.
- VA Rejection: Pin bar at VAH/VAL with volume spike confirms reversal.
- LVN Run: Price blasts through LVN on high volume, targets next HVN.
Risk management: Stop below HVN/VAL, target next node or 1:2 RR. Backtest on TradingView for edge.
Real-World Examples from 2026 Market Movements
Let's dissect 2026 action. In Q1, NVIDIA (NVDA) surged 25% on AI chip demand. Volume Profile on the daily composite showed a massive HVN at $145 after a February consolidation. Price dipped to this node in March, formed a bullish engulfing at POC ($142), and rocketed to new highs—traders entering here banked 20%+ gains.
Contrast with Tesla (TSLA): Post-earnings dump in April created a b-shaped profile with HVN resistance at $420. Price action failed multiple times at VAH with shooting stars, leading to a 15% drop to the next LVN. Short sellers nailed it.
Another gem: Renewable ETF (ICLN) in summer 2026. Amid policy tailwinds, a composite profile highlighted an HVN support at $18.50. Price action showed a double bottom there, breaking VAH on volume—perfect long setup yielding 18% to the next POC.
These examples underscore HVNs' predictive power in real 2026 volatility.
Platform Setup Tips for Volume Profile
Getting started is straightforward:
- TradingView: Free tier has VP fixed range; pro unlocks session profiles. Add via Indicators > Volume Profile Visible Range (VPVR).
- Thinkorswim (Schwab): Robust TPO profiles; customize studies for HVN alerts.
- NinjaTrader: Advanced Order Flow suite with market profile add-ons.
- Mobile: Webull or TradingView app for on-the-go.
Pro Tip: Overlay multiple profiles (e.g., weekly + daily) for multi-timeframe analysis. For official charting docs, visit StockCharts School.
Conclusion: Elevate Your Trading with Volume Profile
Volume Profile demystifies market structure, exposing hidden support and resistance that price action alone misses. By mastering HVNs, VA dynamics, and price confirmations, you're primed for 2026's opportunities. Start paper trading these setups today—consistency compounds.
Refine your edge, manage risk, and let volume guide your trades to profitability.
No comments yet. Be the first!