 Bullish Portfolio

Understanding Moving Averages in Stock Trading
Moving averages are foundational tools in technical analysis, helping traders smooth out price data to identify trends. As we approach 2026, with markets expected to face heightened volatility from AI-driven trading, geopolitical shifts, and economic uncertainties, choosing the right moving average becomes crucial. This article compares Simple Moving Average (SMA) and Exponential Moving Average (EMA), their calculations, strengths, real-world applications for buy/sell signals, and a step-by-step guide to select the best for current conditions.
What is a Simple Moving Average (SMA)?
The SMA is the most straightforward moving average. It calculates the arithmetic mean of a security's price over a specific number of periods, giving equal weight to all data points.
Calculation:
- Select the period (n), e.g., 50 days.
- Sum the closing prices of the last n periods.
- Divide by n: SMA = (P1 + P2 + ... + Pn) / n.
Example: For a 5-day SMA with prices 10, 11, 12, 13, 14: SMA = (10+11+12+13+14)/5 = 12.
SMAs are reliable for long-term trends but lag behind price changes due to equal weighting.
What is an Exponential Moving Average (EMA)?
EMA addresses SMA's lag by applying more weight to recent prices, making it more responsive to new information.
Calculation:
- Smoothing factor (k) = 2 / (n + 1), where n is the period.
- EMA_today = (Close_today × k) + (EMA_yesterday × (1 - k)).
Start with an SMA for the first EMA value.
Example: For a 10-day EMA, k ≈ 0.1818. If yesterday's EMA is 50 and today's close is 52: EMA = (52 × 0.1818) + (50 × 0.8182) ≈ 50.36.
For detailed formulas, check Investopedia.
EMA vs SMA: Key Differences and Strengths in Volatile Markets
Both smooth price action, but their weighting differs profoundly:
- Weighting: SMA equal; EMA recent-heavy.
- Responsiveness: EMA reacts faster; SMA smoother.
- Lag: SMA lags more, ideal for stable trends; EMA reduces lag.
In volatile 2026 markets—think flash crashes from algorithmic trading or crypto crossovers—EMA shines. Its sensitivity catches reversals early, while SMA filters noise in choppy conditions.
Volatile Market Strengths:
- EMA: Quick signals in high-vol environments like 2022's inflation spikes.
- SMA: Avoids whipsaws during sideways volatility.
Common periods: 50/200-day for long-term (SMA favored), 9/21-day for short-term (EMA preferred).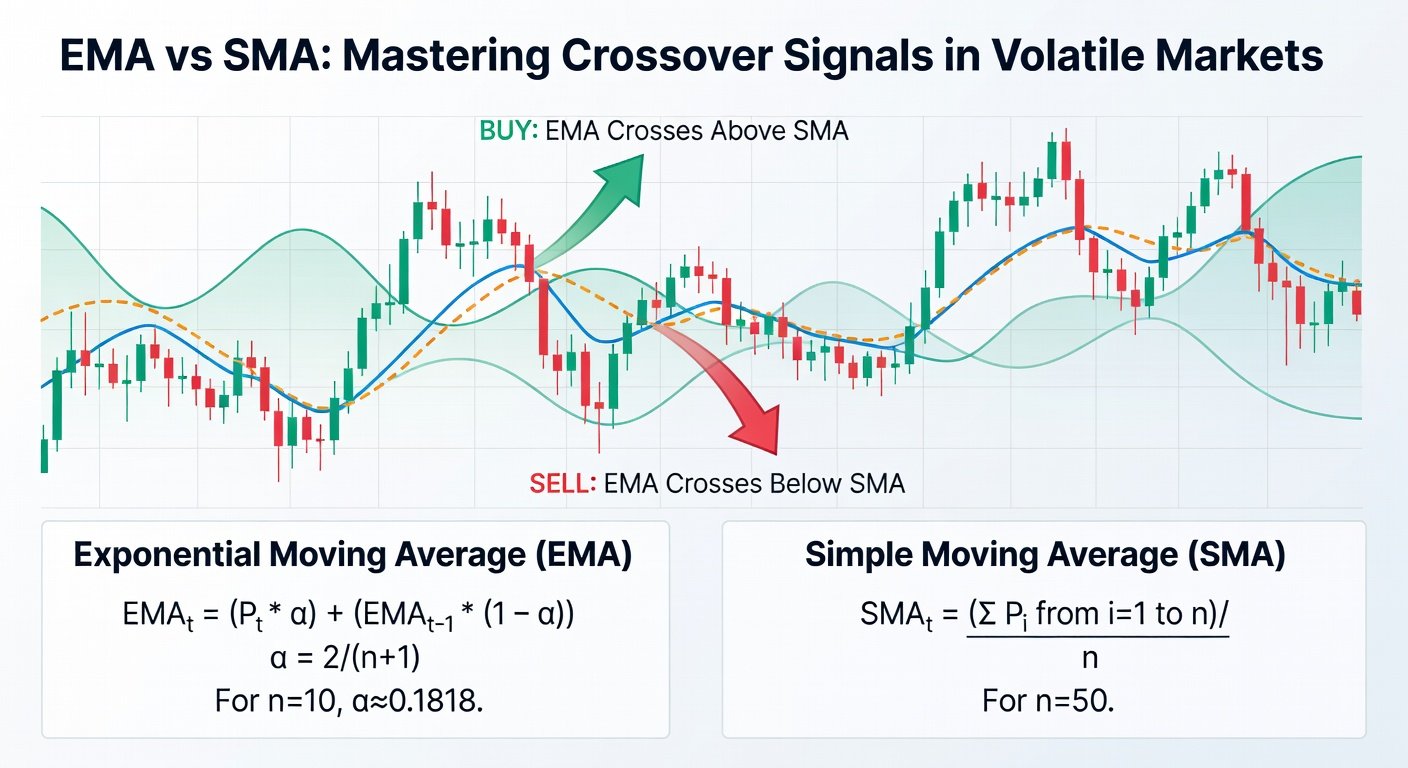
Real-World Examples: Buy/Sell Signals
Traders use crossovers for signals.
SMA Crossover Example – Apple (AAPL) 2023 Bull Run: 50-day SMA crossed above 200-day SMA (Golden Cross) at $150, signaling buy. AAPL rallied 50%. In 2026, use for steady uptrends. View charts on Yahoo Finance.
EMA Crossover Example – Tesla (TSLA) 2024 Volatility: 12-day EMA crossed above 26-day EMA during a dip, generating buy at $220 amid EV hype. Sell signal hit when 12-day crossed below during corrections. EMA's edge: earlier entry/exit.
Death Cross (short MA below long MA) warns sells. Backtests show EMA outperforming SMA by 10-15% in volatile sectors like tech.
Step-by-Step Guide: Selecting EMA or SMA for 2026 Markets
1. Assess Volatility: Use VIX index. VIX > 25? Favor EMA for responsiveness.
2. Define Timeframe: Day trading: EMA (9/21). Swing: SMA (50/200). Long-term: SMA.
3. Market Trend: Trending? SMA confirms. Ranging? EMA avoids false signals.
4. Backtest: Platforms like TradingView: Test on your stock over 5 years.
5. Combine Indicators: Pair with RSI/MACD. E.g., EMA crossover + RSI > 50 = strong buy.
6. Adapt to 2026: Monitor AI sentiment tools; EMA for fast news reactions.
7. Risk Manage: Stop-loss at 2% below signal.
Conclusion: Which Wins in 2026?
No one-size-fits-all—EMA for volatile, dynamic 2026 trends; SMA for confirmation. Blend both: Use EMA for entries, SMA for holds. Master these, and you'll navigate trends like a pro. Start paper trading today!


No comments yet. Be the first!