 Bullish Portfolio
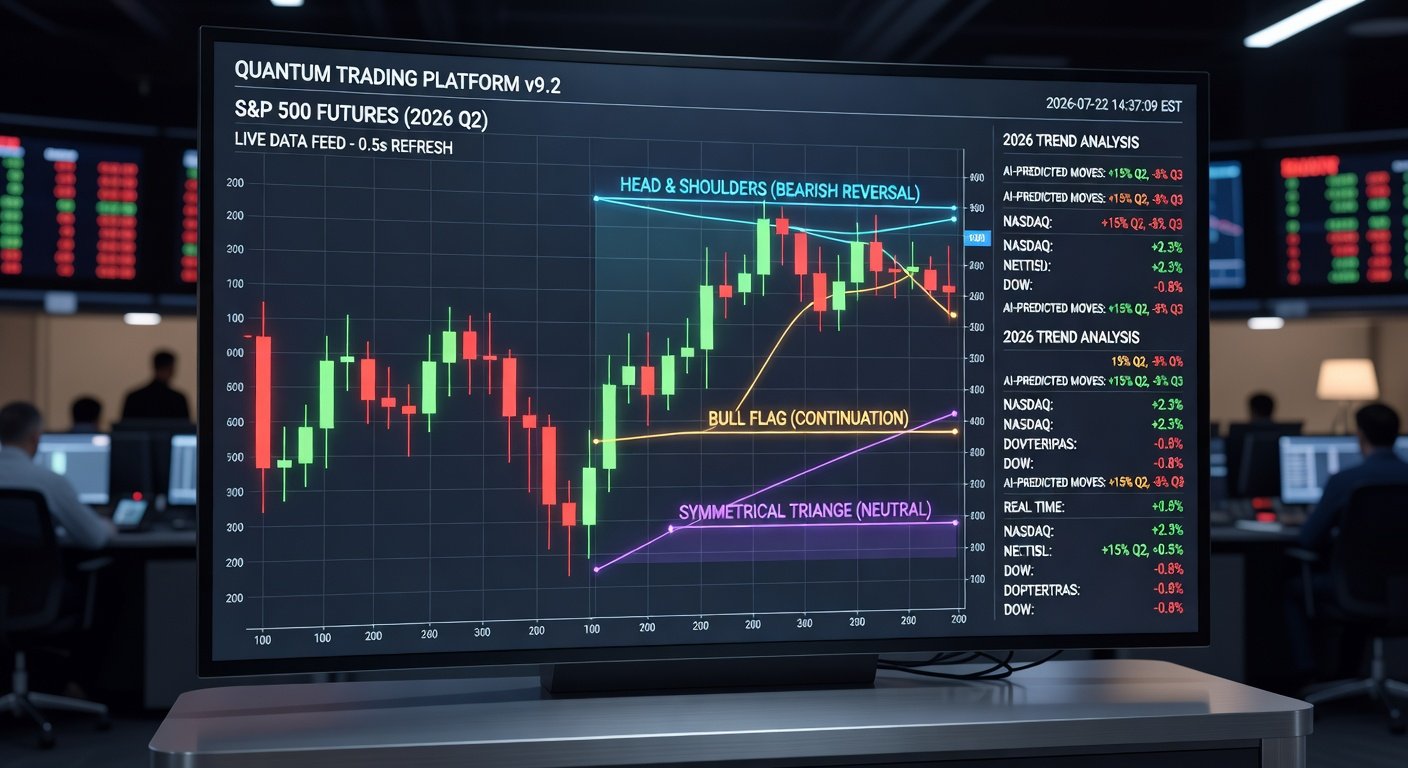
Introduction to Chart Patterns in 2026 Stock Trading
In the fast-evolving stock market of 2026, technical analysis remains a cornerstone for traders seeking an edge. Chart patterns like head and shoulders, flags, and triangles offer reliable signals for reversals and continuations. These formations, rooted in price action psychology, help predict emerging trends amid volatility driven by AI trading, geopolitical shifts, and economic data releases.
This guide provides step-by-step identification methods, proven trading strategies, real-world examples, and essential risk management tips. Whether you're a day trader or swing investor, mastering these patterns can maximize profits while minimizing losses. For foundational knowledge, check out resources from Investopedia.
Head and Shoulders: The Reversal Powerhouse
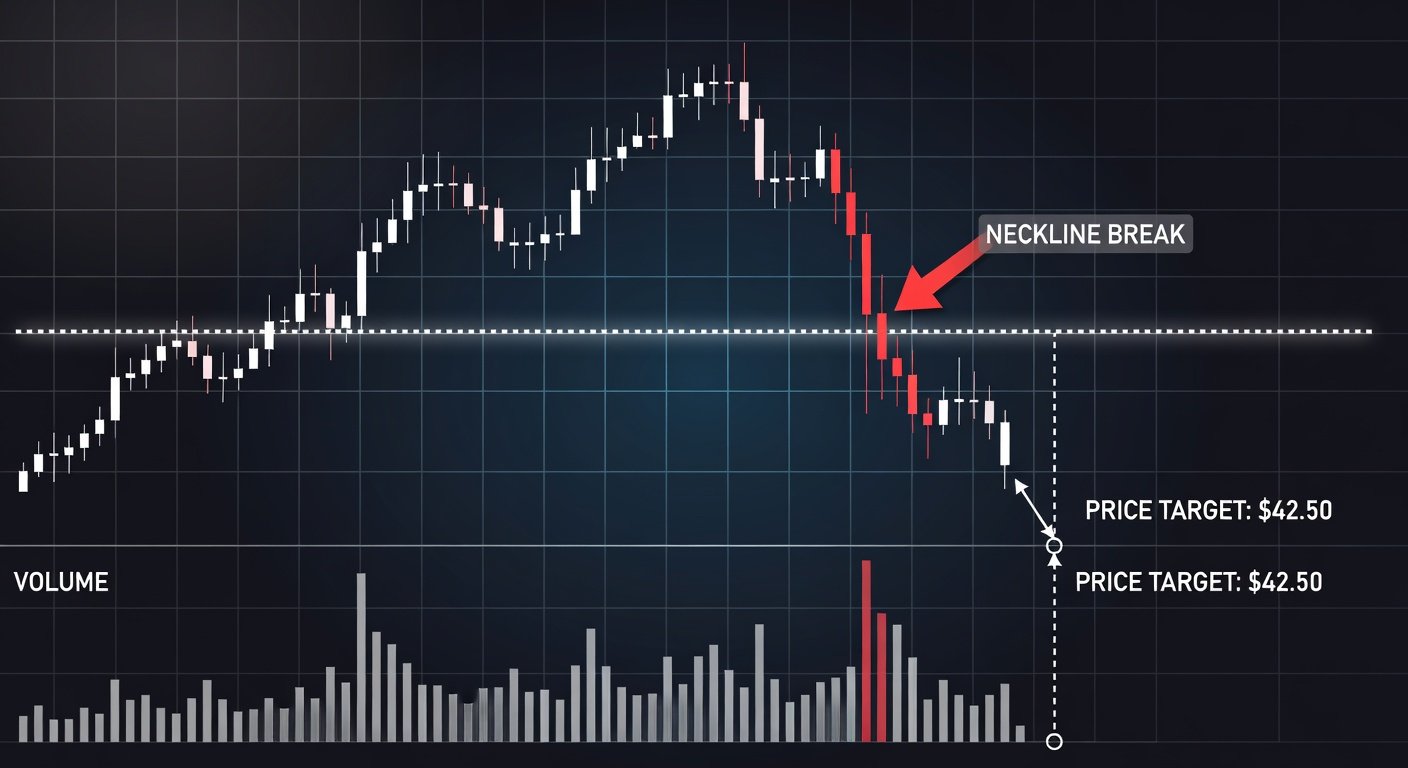
The head and shoulders pattern is a classic reversal signal, typically appearing at market tops (bearish) or bottoms (inverse bullish). In 2026, with high-frequency trading amplifying moves, this pattern's reliability shines in indices like the S&P 500.
Step-by-Step Identification
- Left Shoulder: Price rises to a peak, then pulls back.
- Head: Price surges higher than the left shoulder, forming the central peak, followed by a retracement.
- Right Shoulder: Another rise similar to the left shoulder, but lower volume signals weakness.
- Neckline: Draw a line connecting the lows between shoulders and head. Break below (bearish) or above (inverse) confirms.
Volume decreases on the right shoulder, confirming exhaustion. Target: Measure head-to-neckline distance and project downward.
Trading Strategies
- Enter short on neckline break with stop above right shoulder.
- For inverse (bullish), buy neckline break with stop below.
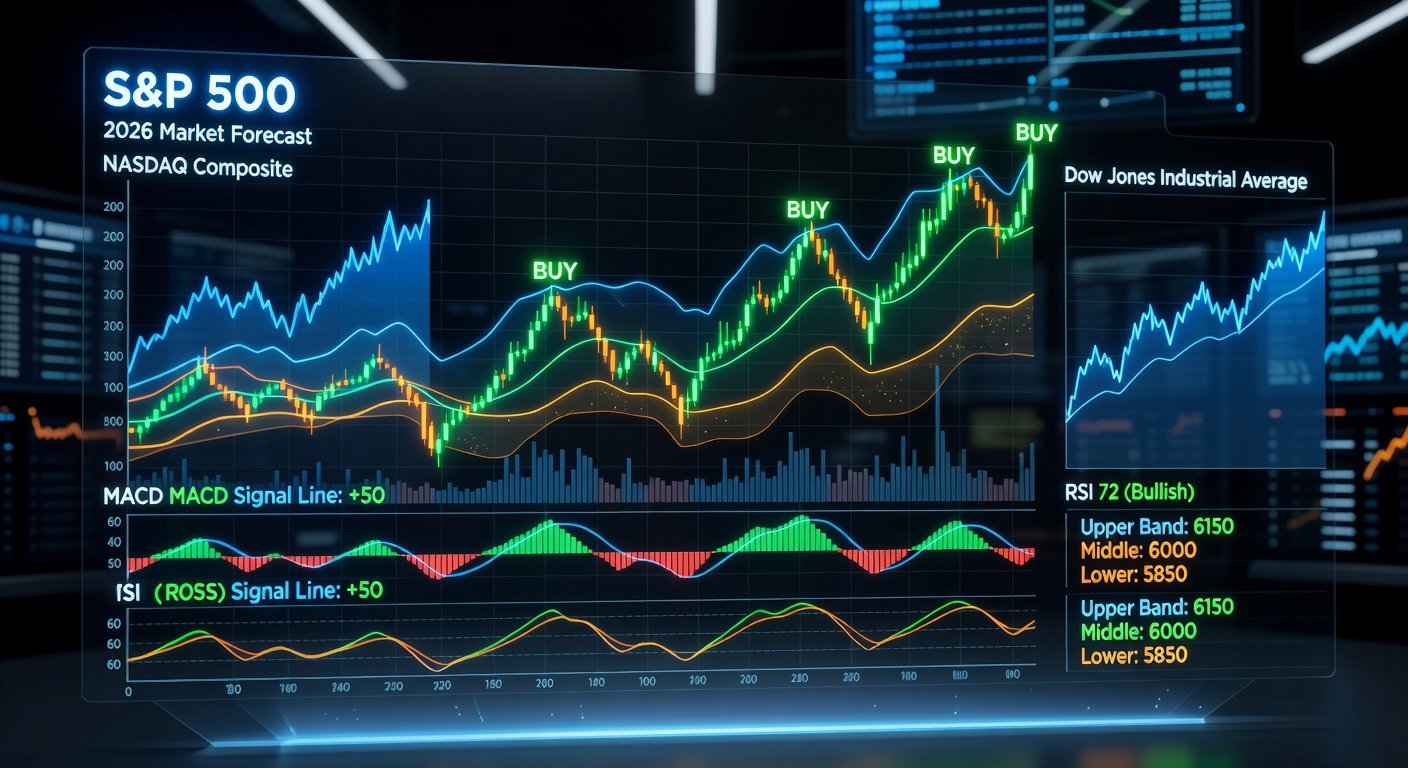
- Use RSI < 50 for bearish confirmation.
Example
In early 2025, Tesla (TSLA) formed a head and shoulders on its daily chart post-earnings hype. Neckline break at $250 led to a 20% drop, hitting the target precisely. Traders shorting captured quick profits.
Flags: Continuation Patterns for Momentum Trades
Flags are short-term continuation patterns resembling a flag on a pole. Bullish flags slope downward in uptrends; bearish upward in downtrends. Ideal for 2026's volatile sessions fueled by Fed rate decisions.
Step-by-Step Identification
- Pole: Sharp, high-volume move (the 'flagpole').
- Flag Body: Parallel channel consolidating opposite the pole's direction, lasting 1-3 weeks.
- Breakout: Price breaks in pole's direction on increased volume.
- Target: Pole length added to breakout point.
Flags fail if consolidation exceeds 50% retracement or volume doesn't surge on breakout.
Trading Strategies
- Buy breakout above flag resistance; stop below flag low.
- Scale in on pullbacks within the flag.
- Combine with MACD crossover for confluence.
Example
During the 2025 AI boom, NVIDIA (NVDA) formed a bullish flag after a 15% pole rally. Breakout from $120 led to $180 target, rewarding early entrants with 50% gains in weeks.
Triangles: Coiling Tension for Breakouts
Triangles—symmetrical, ascending, descending—signal consolidation before explosive moves. Symmetrical are neutral; ascending bullish; descending bearish. In 2026, expect them in crypto-stock hybrids amid regulatory news.
Step-by-Step Identification
- Converging Trendlines: Higher lows and lower highs (symmetrical); flat top/higher lows (ascending); flat bottom/lower highs (descending).
- Volume Decline: Shrinks as apex nears.
- Breakout: 75% of pattern width; upward for bullish, downward bearish.
- Target: Base width projected from breakout.
Avoid trading near apex; wait for clear breaks.
Trading Strategies
- Enter on breakout with volume > 50% average.
- Stop opposite trendline.
- Fade false breaks with tight stops.
Example
Apple (AAPL) in mid-2025 showed an ascending triangle on weekly charts. Break above $220 resistance targeted $260, aligning with product launch hype for 18% upside.
Learn more about technical patterns from the SEC Investor Education resources.
Risk Management Tips for Volatile 2026 Markets
Chart patterns aren't foolproof—false breaks occur 20-30% of the time. Protect capital with these strategies:
- Position Sizing: Risk 1-2% per trade. If stop is 5% away, size accordingly.
- Stops & Targets: Always use hard stops; aim 1:2 risk-reward minimum.
- Confirmation Tools: Pair patterns with volume, moving averages (e.g., 50/200 SMA cross), or ADX > 25.
- Market Context: Avoid tops in bear markets; check VIX for volatility.
- Diversify: Limit patterns to 20% of portfolio; blend with fundamentals.
For advanced charting, explore tools from CME Group.
Conclusion: Chart Your Path to 2026 Profits
Head and shoulders, flags, and triangles equip you to navigate 2026's market turbulence. Practice on demo accounts, backtest strategies, and stay disciplined. Consistent application turns patterns into profits—start identifying today for tomorrow's trends.

No comments yet. Be the first!