 Bullish Portfolio
Introduction to 2026 Stock Market Trends
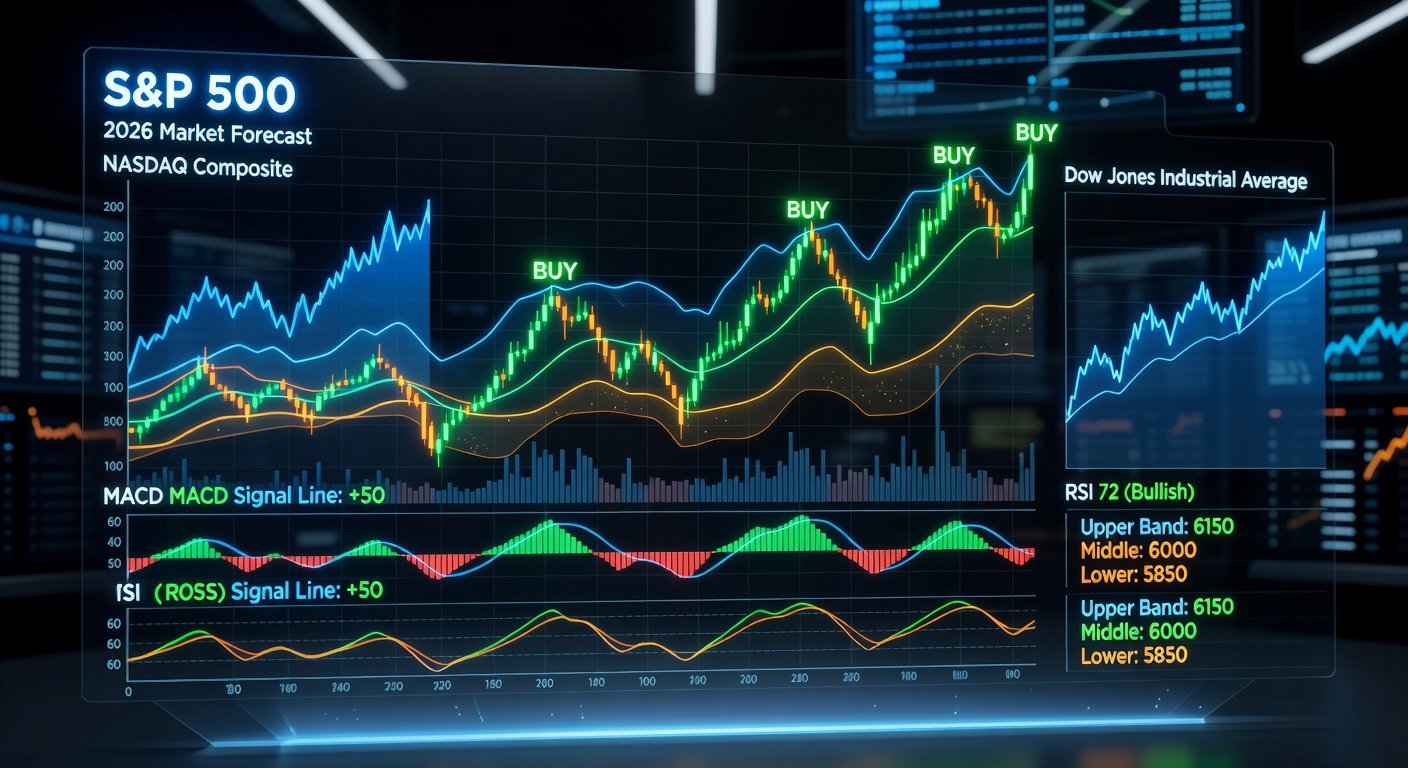
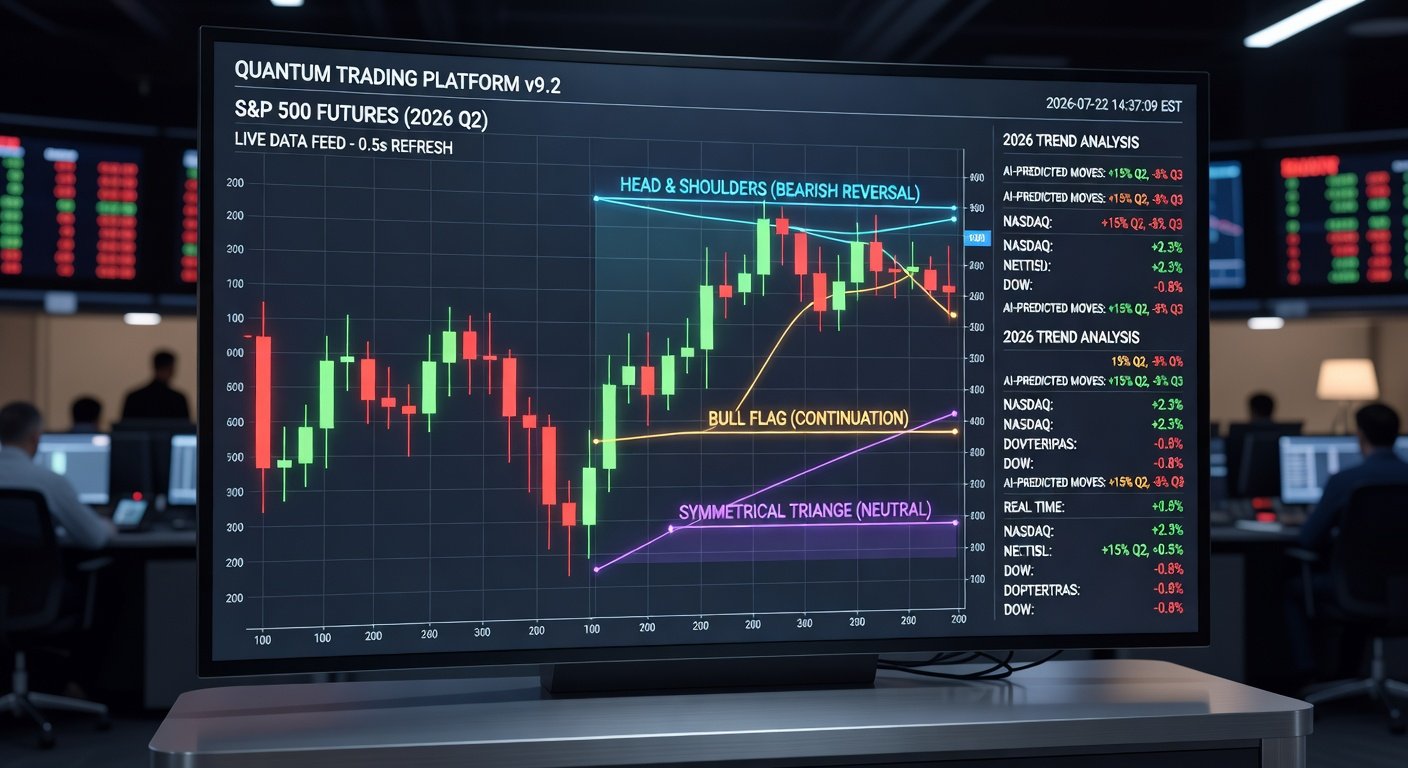
The stock market in 2026 is poised for heightened volatility due to geopolitical shifts, AI-driven economic changes, and interest rate fluctuations. Investors need robust technical analysis tools to navigate this landscape. This guide covers RSI, MACD, and Bollinger Bands—from beginner basics to advanced strategies. We'll analyze major indices like S&P 500, NASDAQ, and Dow Jones, provide step-by-step examples, hypothetical chart predictions, and actionable buy/sell signals.
Technical analysis empowers traders to spot momentum shifts, overbought/oversold conditions, and volatility squeezes. Whether you're a novice or pro, mastering these indicators can boost your edge in 2026's turbulent markets.
Understanding RSI: The Momentum Oscillator
Relative Strength Index (RSI) measures price momentum on a 0-100 scale. Developed by J. Welles Wilder, it's ideal for identifying overbought (>70) and oversold (<30) conditions.
Beginner Step-by-Step: Calculating and Reading RSI
- Select a timeframe: Use 14-period RSI on daily charts for swing trading.
- Plot RSI: Most platforms like TradingView auto-calculate it below the price chart.
- Interpret signals: RSI <30 = potential buy (oversold). RSI >70 = potential sell (overbought).
Example for S&P 500 in 2026: Imagine Q1 2026: After a dip from Fed rate hikes, RSI hits 25 on the daily chart. This signals a reversal as buying pressure builds. Prediction: S&P 500 bounces 5-8% from 5,200 to 5,500.
Advanced RSI Strategies
- Divergence: Bullish if price makes lower lows but RSI higher lows—buy signal.
- Failure Swings: RSI breaks above 30 after oversold, then pulls back without new lows—strong buy.
- Combine with trendlines: RSI centerline (50) crossover confirms uptrends.
In volatile 2026 NASDAQ (tech-heavy), watch RSI divergences amid AI stock rotations for early entries.
MACD: Spotting Trend Changes and Momentum
Moving Average Convergence Divergence (MACD) tracks the relationship between two EMAs (12-period and 26-period). It includes the MACD line, signal line (9-period EMA), and histogram.
Beginner Guide to MACD Signals
- Line Crossover: MACD crosses above signal = bullish buy. Below = bearish sell.
- Zero Line Cross: Above zero = uptrend momentum; below = downtrend.
- Histogram: Widening bars show strengthening momentum.
Dow Jones 2026 Prediction: Post-election volatility pushes MACD below zero in early 2026. A bullish crossover near 38,000 signals a rally to 41,000 as industrial sectors recover.
Advanced MACD Techniques
- Divergence: Price highs with lower MACD peaks = weakening trend, sell.
- Slope Analysis: Steepening MACD slope predicts acceleration.
- Histogram Patterns: Zero-line rejection setups for scalps.
For NASDAQ in 2026, MACD histogram contractions during earnings season precede explosive moves—perfect for options traders.
Bollinger Bands: Volatility and Mean Reversion
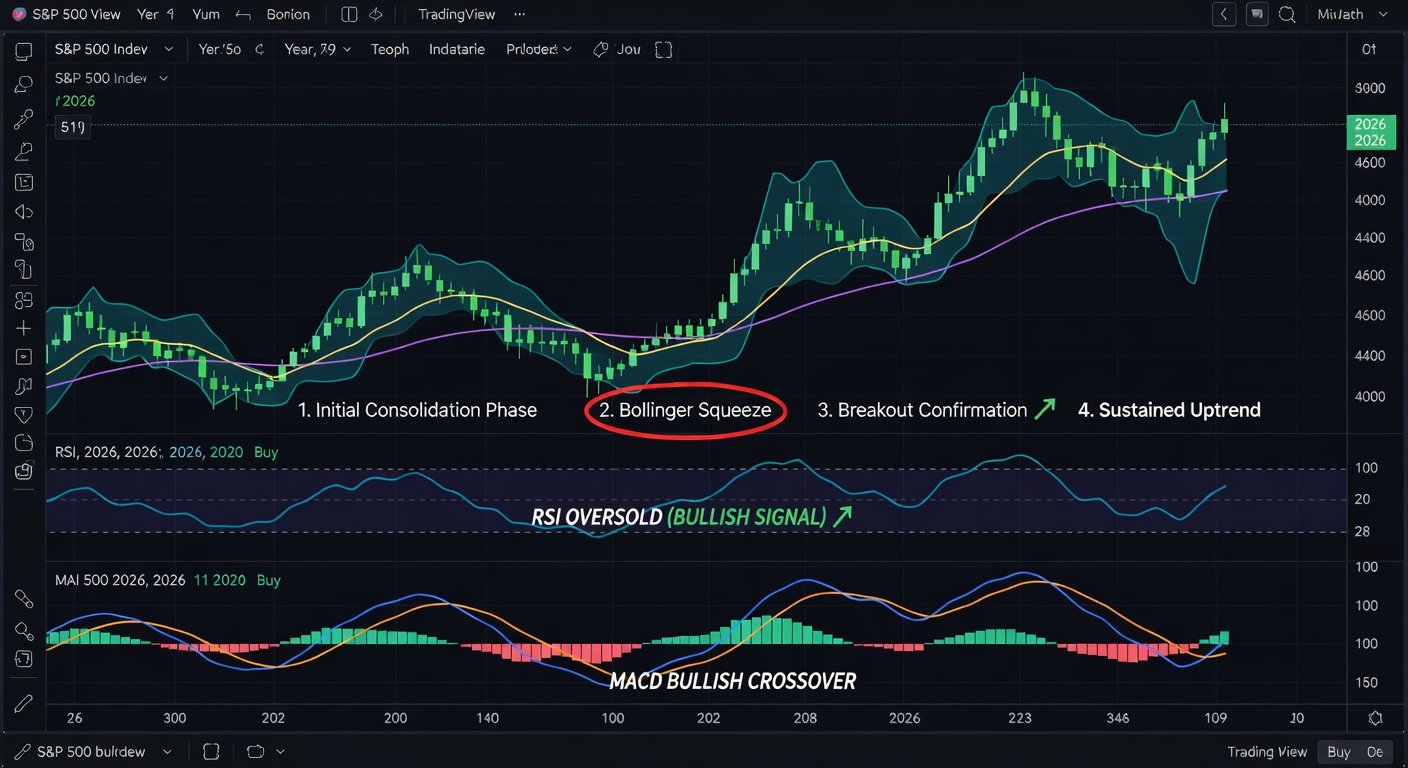
John Bollinger's Bands use a 20-period SMA with ±2 standard deviations. They expand in volatility and contract in squeezes, signaling breakouts.
Step-by-Step for Beginners
- Band Touch: Price at lower band = oversold buy opportunity.
- Upper Band: Overbought sell, unless in strong uptrend ("walking the band").
- Squeeze: Narrow bands = low vol; expansion = big move imminent.
S&P 500 2026 Scenario: Mid-year squeeze after inflation cools. Upper band breakout from 5,600 targets 6,000 as volatility spikes.
Advanced Bollinger Strategies
- %B Indicator: <0 = below lower band (buy); >1 = above upper (sell).
- BandWidth: Low values predict volatility expansion.
- Combine with Keltner Channels: Band squeeze outside Keltner = directional breakout.
Dow Jones in late 2026: Lower band tag during recession fears, followed by squeeze—buy for 10% upside.
Combining RSI, MACD, and Bollinger Bands for 2026 Predictions
Confluence is key. Wait for alignment:
- Bullish Setup: RSI >50, MACD bullish cross, price off lower Bollinger.
- Bearish: RSI <50, MACD bearish, upper band rejection.
Major Indices Outlook:
- S&P 500: RSI oversold + Bollinger squeeze in Q2 = buy to 6,200 by year-end.
- NASDAQ: MACD divergence resolves bullishly amid tech boom—target 22,000.
- Dow: Volatility favors mean reversion; bands guide entries post-39,000 pullback.
Actionable Strategies Amid 2026 Volatility
1. Swing Trading Plan:
- Enter on RSI oversold + MACD cross + lower band touch.
- Exit at upper band or RSI 70.
- Risk 1% per trade.
2. Scalping in Squeezes: Bollinger squeeze + MACD histogram buildup = 1-2% intraday targets.
3. Portfolio Hedging: Use signals for index ETFs like SPY, QQQ. Short volatility (VIX) when bands expand.
Risk Management: Always use stop-losses below recent lows. Backtest on historical data. In 2026's high-vol environment, position sizing is crucial—never risk more than 2% on one idea.
Tools and Platforms for Implementation
Free: TradingView for charts. Paid: Thinkorswim for advanced scans. Set alerts for RSI<30, MACD crosses, and squeezes.
Practice on paper trading before live 2026 trades. Stay updated on macro events like Fed meetings that amplify signals.
Conclusion: Gear Up for 2026 Success
RSI, MACD, and Bollinger Bands demystify 2026 trends. From spotting oversold bounces to volatility breakouts, these tools offer clear buy/sell signals. Start simple, layer advanced tactics, and combine for confluence. Trade smart, manage risk, and position for the indices' upside potential.
No comments yet. Be the first!