 Bullish Portfolio
Introduction to Order Flow Analysis in 2026 Markets
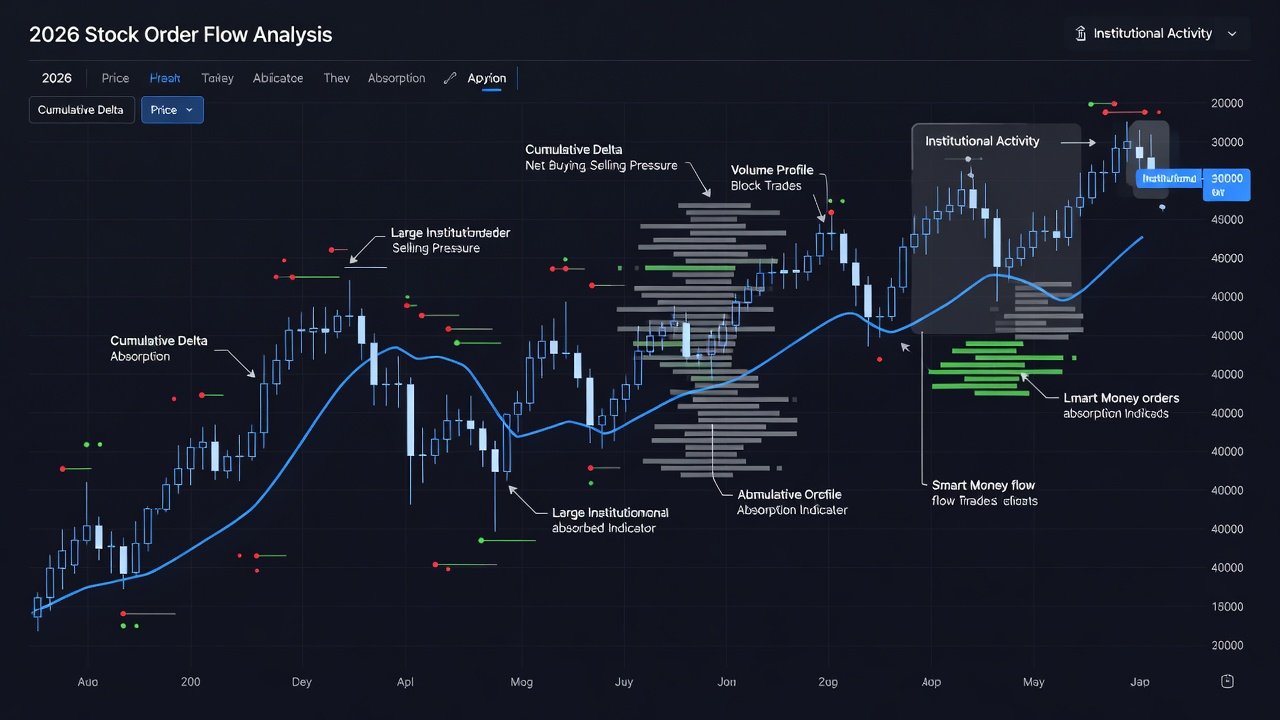
Order flow analysis has emerged as an essential tool for traders seeking to understand the hidden dynamics behind stock price movements in 2026. Unlike traditional price charts that show only the outcome of buying and selling, order flow reveals the actual transactions occurring at each price level, highlighting institutional participation and potential reversals. This advanced approach helps decode market sentiment by examining the flow of buy and sell orders in real time, providing insights into how large players influence trends across major exchanges. In volatile sessions throughout 2026, order flow data has proven particularly valuable for identifying shifts before they appear on standard candlestick charts. By focusing on executed trades rather than bids and offers alone, analysts can spot absorption where large orders are quietly absorbed without moving prices significantly, offering a decisive edge in fast-moving environments.
Understanding the Mechanics of Order Flow in Modern Markets
Order flow operates at the granular level of individual trades, capturing every market order as it hits the exchange. This data stream allows traders to see the aggressive buying or selling pressure that drives price action. In 2026, with increased algorithmic participation, order flow becomes even more critical because it cuts through noise created by high-frequency systems. The methodology draws from futures and equities markets where tick-by-tick data is readily available, enabling precise reconstruction of market depth and intent.
Cumulative Delta
Cumulative delta tracks the net difference between aggressive buy and sell orders over time. Positive delta indicates buyers dominating, while negative values signal seller control. In 2026, traders monitor divergences between cumulative delta and price action to anticipate reversals, such as when prices rise but delta flattens or turns negative. This divergence often precedes pullbacks and has been observed repeatedly in indices like the S&P 500 during earnings seasons.
Volume Clusters
Volume clusters highlight price levels with unusually high trading activity. These areas often act as support or resistance because they represent zones where significant institutional interest occurred. Visual examples typically show stacked horizontal bars representing traded volume at specific prices, helping traders anticipate where future battles between buyers and sellers may unfold. Clusters formed during overnight sessions frequently influence the next day’s opening range.
Absorption Patterns
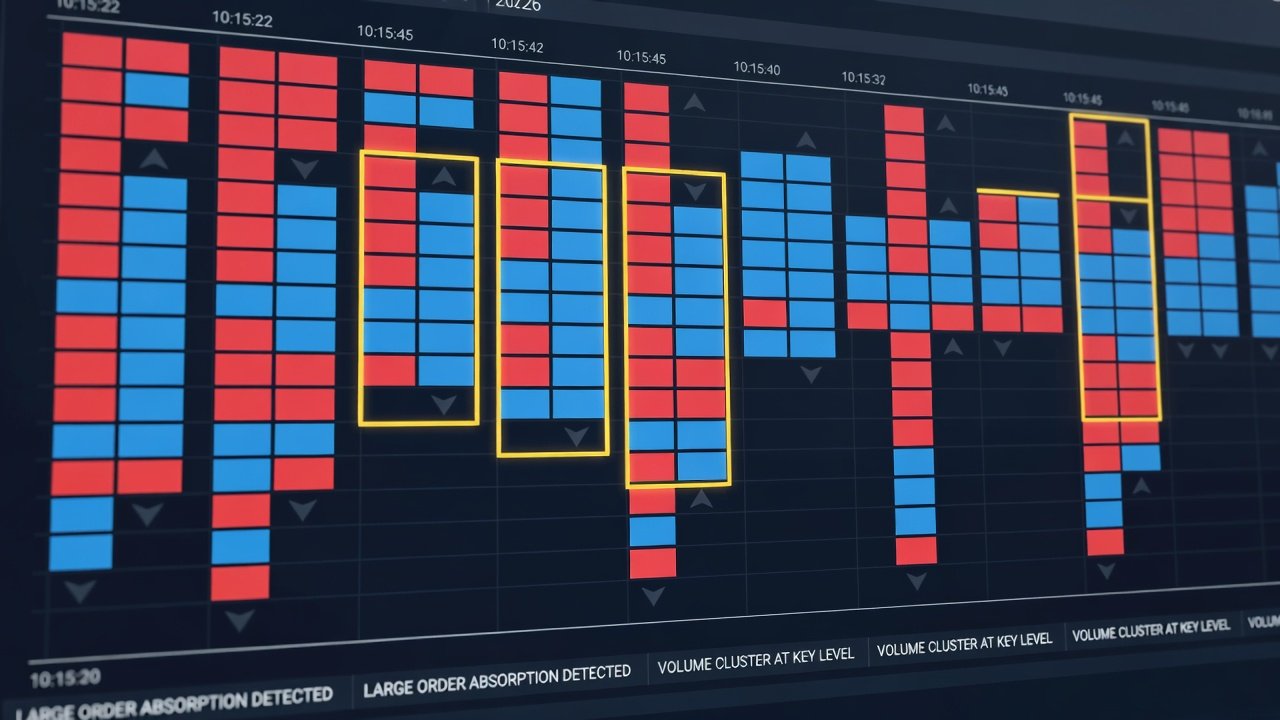
Absorption occurs when large orders are filled without corresponding price movement, suggesting strong opposing interest. This pattern frequently precedes breakouts or breakdowns as one side exhausts its capacity. Traders watch for heavy volume on one side paired with minimal price progress, a signal that hidden liquidity is being taken out of the market.
Step-by-Step Framework for Daily Integration
Traders can follow a structured framework to incorporate order flow into existing routines. First, select a platform that provides accurate tick data and footprint charts with reliable exchange feeds. Second, align order flow observations with higher-timeframe technical levels for confluence, ensuring order flow signals do not contradict weekly or daily support zones. Third, monitor cumulative delta during key sessions such as the first and last hours of trading to confirm momentum strength. Fourth, use volume profiles to identify high-probability entry zones around previous day highs and lows. Fifth, backtest patterns against historical 2026 data to refine interpretation skills before live deployment. Sixth, maintain a trading journal that logs delta readings alongside entry and exit decisions for ongoing review.
Order Flow vs Traditional Indicators: Detailed Comparison
Traditional indicators like moving averages and RSI rely solely on price history, often lagging behind real market activity. Order flow, by contrast, offers leading information through direct transaction visibility. While price indicators excel at trend identification over longer periods, order flow shines in pinpointing precise entry timing during intraday volatility. Many analysts combine both approaches for balanced decision-making, using moving averages to define bias and order flow to time entries. This hybrid method reduces false signals common in pure indicator-based systems and improves risk-reward ratios across different market regimes.
Real-World Case Studies from 2026 Volatile Sessions
During the March 2026 tech sector swings, order flow revealed absorption at key support levels before major rebounds in names like NVDA and AMD. Cumulative delta turned positive ahead of price confirmation, allowing early positioning with tight stops. Another example from the energy markets showed volume clusters forming at previous highs, which later acted as resistance during sell-offs triggered by inventory reports. In the banking sector during April 2026 volatility, absorption patterns appeared on the bid side before a sharp rally, confirmed by rising cumulative delta that outpaced price advances. These cases illustrate how order flow provides context that price charts alone cannot deliver, particularly when news catalysts create sudden liquidity shifts.
Practical Checklists and Entry Timing Strategies
- Confirm cumulative delta alignment with price direction on the 5-minute and 15-minute timeframes.
- Identify volume cluster support or resistance nearby using session profiles.
- Watch for absorption signs before committing capital, ensuring volume exceeds average session levels.
- Cross-reference with broader market context from sources like SEC.gov.
- Exit if delta diverges sharply from price for more than two consecutive bars.
- Scale into positions only after initial absorption confirmation to manage risk effectively.
Advanced Tips and Common Pitfalls to Avoid
Successful order flow traders emphasize context over isolated signals. Always consider the broader market regime, such as trending versus range-bound conditions, because absorption behaves differently in each. Common errors include misidentifying low-volume periods as absorption, ignoring overnight session data, and over-relying on a single footprint chart without multi-timeframe confirmation. Another frequent mistake is entering trades solely on delta spikes without checking for nearby volume clusters that could act as barriers. Traders should also avoid platforms with delayed or incomplete data feeds, as accuracy is paramount. Regular review of recorded sessions helps identify personal interpretation biases before they impact live performance.
FAQs on Platform Selection and Interpretation Errors
What platforms support robust order flow tools?
Popular choices include those integrated with major exchanges, offering footprint and delta analytics. Always verify data accuracy through CME Group resources before committing to any software subscription.
How to avoid common misreads of absorption?
Distinguish true absorption from low-volume periods by checking overall market participation. Cross-check findings with NYSE data feeds for confirmation and maintain strict rules around minimum volume thresholds.
Conclusion
Order flow analysis equips traders with deeper market insight for navigating 2026 stock trends. By mastering its core components and integrating them thoughtfully with existing technical methods, market participants gain an edge in timing and risk management that price-only methods cannot match. Consistent practice and disciplined checklist usage turn this powerful technique into a reliable component of any professional trading process.
No comments yet. Be the first!