 Bullish Portfolio
Introduction to Technical Analysis in 2026 Tech Markets
Technical analysis remains a cornerstone for traders navigating volatile tech stocks in 2026. This article presents detailed case studies on major names like NVDA, AAPL, and MSFT, revealing how indicators such as moving averages combined with volume data uncover actionable trends. Readers will gain step-by-step insights into chart patterns, signal generation, and performance outcomes from both winning and losing trades. The focus extends beyond basic overviews to include practical implementation details, risk management frameworks, and real scenario breakdowns that help investors adapt these methods effectively. In a year marked by rapid innovation cycles and macroeconomic shifts, understanding these tools provides a measurable edge for both short-term traders and longer-term portfolio builders seeking data-driven decisions.
Overlaying Moving Averages with Volume Analysis
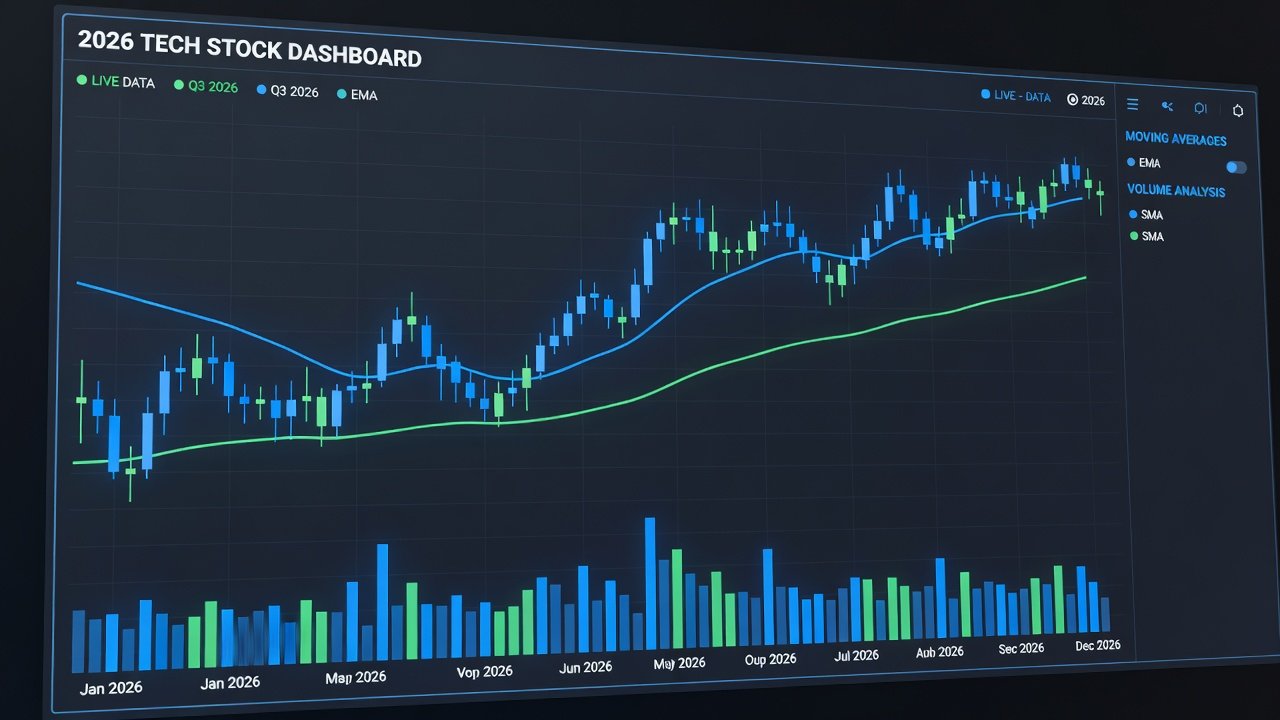
Combining simple and exponential moving averages (SMAs and EMAs) with volume profiles helps confirm trend strength. In one NVDA case study from early 2026, the 50-day EMA crossed above the 200-day SMA amid rising volume, signaling a bullish continuation. Traders who entered on this crossover captured substantial upside before profit-taking emerged. Volume spikes above average levels validated the move, reducing false signal risks. To apply this approach, begin by selecting appropriate timeframes on your charting platform, then layer the 50-day and 200-day averages while observing volume histograms for surges exceeding the 20-day average. Additional confirmation comes from checking higher-timeframe alignment, such as weekly charts showing the same directional bias. This layered method proved especially useful during earnings seasons when price action alone can mislead.
Key steps include: plotting the averages on daily charts, monitoring volume bars for confirmation, and waiting for price to hold above the crossover point. This method filters noise in high-growth sectors where momentum can reverse quickly. Practitioners should also track the distance between the averages to gauge trend momentum intensity.
Spotting Trend Continuations in Tech Stocks
Trend continuation patterns, such as flags and pennants, appeared frequently in AAPL charts throughout 2026. After an initial breakout above resistance, pullbacks on declining volume often preceded resumption of the uptrend. Risk-adjusted comparisons showed AAPL outperforming MSFT in Sharpe ratio terms during these periods due to tighter stop placements. Identifying these setups requires measuring the initial impulse move, locating the consolidation boundary, and projecting targets based on the flagpole length. Volume contraction during the pause followed by expansion on breakout serves as the primary trigger. In multiple documented instances, traders who waited for this volume confirmation avoided premature entries that led to whipsaws.
Practical example: Identify the consolidation phase post-breakout, measure the flagpole height for target projection, and set stops below the recent swing low. Successful trades yielded consistent returns within weeks when volume contracted appropriately during the pause. Extending analysis to sector peers can further validate whether the continuation is isolated or part of broader market rotation.
Entry and Exit Signals: Annotated Chart Reviews
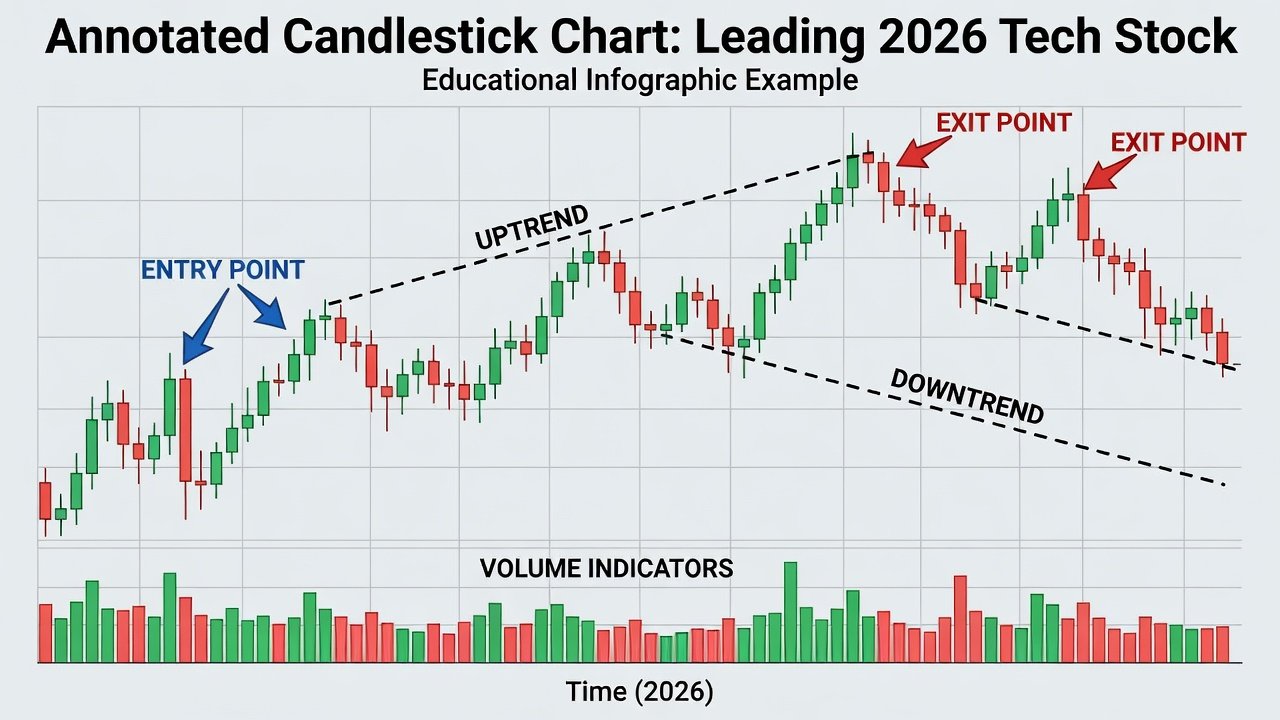
Entry signals typically trigger on moving average crossovers supported by volume surges, while exits rely on RSI divergences or trailing stops. In a failed MSFT trade, an early entry on a volume spike ignored overbought conditions, leading to a significant drawdown before reversal. Lessons emphasize waiting for multiple confirmations rather than isolated indicators. Annotated charts from these periods illustrate how combining the crossover with RSI below 70 and positive volume divergence creates higher-probability setups. Exit discipline proved equally critical, with trailing stops based on the 20-day EMA helping lock in gains during extended rallies while allowing room for normal volatility.
Successful scenarios across the portfolio demonstrated the value of scaling out positions: partial exits at predefined risk-reward ratios preserved gains during volatile sessions. Reviewing full trade logs reveals that patience at entry often outweighed the desire for immediate action, particularly when macroeconomic data releases were imminent.
Risk-Adjusted Comparisons Across Tech Leaders
Comparing NVDA, AAPL, and MSFT reveals varying risk profiles. NVDA exhibited higher beta but superior returns in trending markets, while AAPL offered more stable volatility. Use metrics like maximum drawdown and win rate to tailor position sizing. Diversifying across these names reduced overall portfolio variance in backtested 2026 scenarios. Additional considerations include correlation analysis between the stocks and broader indices to avoid unintended concentration risk. NVDA's larger swings demanded smaller position sizes relative to AAPL when maintaining equivalent portfolio risk levels.
Backtesting Technical Strategies on Historical Data
Before deploying any strategy live, thorough backtesting on at least two years of prior data is essential. Tools that replay price and volume action allow traders to simulate entries and exits under varying market regimes. In one extended test covering late 2024 through 2025, the moving average plus volume filter delivered a win rate above 60 percent with controlled drawdowns. Key variables to optimize include the exact moving average periods and volume threshold multipliers. Always account for slippage and commission costs in the model to ensure realistic projected results.
Lessons from Successful and Failed Trades
- Always incorporate volume to avoid low-conviction signals.
- Adjust stops dynamically based on average true range.
- Review weekly charts alongside daily for broader context.
- Document every trade to refine future entries.
- Cross-reference with sector ETF performance for additional confirmation.
- Avoid trading during major news events unless volume surge clearly supports the move.
Failed trades often stemmed from ignoring macroeconomic overlays, such as interest rate announcements impacting sector sentiment. Maintaining a detailed journal that records emotional state at entry further improves future discipline.
Scaling Methods to Personal Portfolios
Retail investors can apply these techniques by starting with paper trading, then allocating small percentages to live positions. Focus on liquid names and maintain a trading journal for continuous improvement. Begin with one or two stocks, gradually expanding the watchlist only after consistent results over at least three months. Position sizing rules should limit risk to one percent of total capital per trade initially.
FAQ
How reliable are moving average crossovers in 2026 tech stocks?
They perform best when paired with volume and multiple timeframes, though no indicator guarantees outcomes.
What is the best way to manage risk in volatile tech names?
Use position sizing based on account risk tolerance and place stops beyond key support levels identified on charts.
Can these strategies work for long-term investors?
Yes, adapted versions using weekly charts suit buy-and-hold approaches with periodic rebalancing.
How many indicators should be used together?
Two to three complementary tools, such as moving averages, volume, and RSI, typically strike the optimal balance between clarity and complexity.
Is backtesting sufficient preparation?
Backtesting provides valuable insights but should be followed by forward testing on current market conditions before committing real capital.
Conclusion
Technical analysis case studies on 2026 tech stocks highlight the power of disciplined indicator use. By mastering moving averages, volume confirmation, and risk management, traders can improve decision-making across market conditions. Continue studying real charts and backtesting to build confidence. For foundational concepts, consult Investopedia, review resources from SEC.gov, and explore market structure details at Nasdaq.com.

No comments yet. Be the first!