 Bullish Portfolio
Introduction to Sector Rotation Strategies in 2026
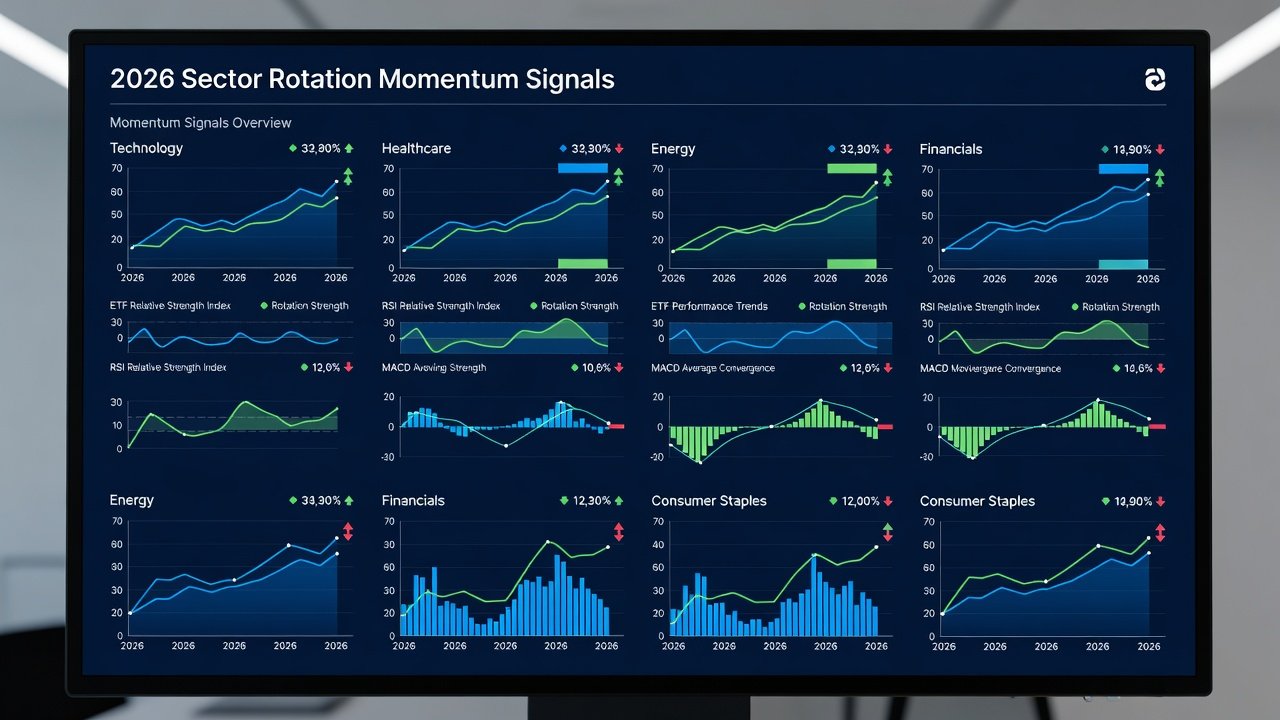
Sector rotation remains a powerful approach for navigating equity markets, especially as economic cycles evolve through phases of expansion, peak, contraction, and recovery. In 2026, momentum signals provide traders with timely cues to shift allocations toward outperforming sectors ahead of broader market moves. This comprehensive guide focuses on technical tools including the Relative Strength Index (RSI) and Moving Average Convergence Divergence (MACD) to detect rotation points early. Intermediate traders will gain actionable frameworks for comparing sectors, monitoring volume shifts, mapping cycles, and integrating risk management while avoiding common pitfalls that erode returns.
Why Momentum Indicators Matter for Sector Rotation
Momentum indicators help quantify the speed and strength of price movements across sectors, allowing traders to move beyond simple price action into predictive territory. By analyzing these signals, traders can anticipate shifts before they become obvious in price charts alone. Relative strength comparisons between sectors, such as technology versus utilities or energy versus consumer staples, reveal leadership changes driven by economic data releases, interest rate decisions, or geopolitical events. Volume analysis adds critical confirmation, showing whether institutional participation supports a rotation or if retail-driven noise is at play. Without momentum context, sector rotations often appear random, leading to mistimed entries and exits.
Core Tools: RSI and MACD Explained in Depth
The RSI measures overbought and oversold conditions on a 0-100 scale using a 14-period default setting. Readings above 70 often signal potential reversals in momentum, while below 30 indicate oversold opportunities ripe for rotation into defensive sectors. For sector rotation, apply RSI to sector ETFs and compare readings across groups on both daily and weekly timeframes to filter noise. MACD, which tracks the relationship between two exponential moving averages (typically 12 and 26 periods) with a 9-period signal line, highlights changes in momentum through crossovers and histogram bars. Positive histogram expansion typically precedes sustained sector outperformance, while bearish divergences warn of fading leadership. Both indicators work best when combined with broader market context rather than in isolation. Historical patterns from 2023-2025 show RSI divergences often preceded major rotations during volatility spikes triggered by inflation data.
Advanced users combine RSI with MACD histogram slope analysis to confirm strength. For instance, an RSI holding above 50 paired with expanding MACD bars provides higher conviction for entering a leading sector position.
Relative Strength Comparisons Between Sectors
Begin by calculating relative strength ratios, such as the price of one sector ETF divided by another or against the S&P 500 benchmark. Rising ratios indicate clear leadership, while falling ratios signal weakening sectors to exit. In practice, compare cyclical sectors like industrials and materials against defensives like consumer staples and utilities during different economic phases. During early recovery stages, growth-oriented sectors such as technology and communication services frequently outperform. Tools from Investopedia offer detailed ratio charting tutorials that complement this analysis. Traders should also track sector correlations, noting when they rise sharply during risk-off environments, which can invalidate isolated momentum signals.
Volume Shifts and Cycle Mapping
Volume spikes accompanying price advances confirm genuine momentum rather than speculative moves. Declining volume on pullbacks suggests healthy rotations rather than impending reversals. Cycle mapping overlays these signals onto economic calendars, aligning sector moves with indicators such as employment reports, GDP releases, or Fed policy announcements. This layered approach reduces false signals common in choppy or news-driven markets. For example, rising volume in financials ahead of rate-cut expectations often marks the start of a sustained rotation out of defensives.

Step-by-Step Setup for Identifying Leading Sectors
- Select a diversified basket of sector ETFs covering all eleven major groups including technology, healthcare, financials, energy, industrials, consumer discretionary, consumer staples, utilities, real estate, materials, and communication services.
- Plot RSI (14-period) and MACD (12,26,9) on daily and weekly charts for each ETF using reliable charting platforms.
- Scan systematically for sectors showing RSI above 50 with rising MACD histograms and positive signal line crossovers.
- Confirm findings with relative strength ratios outperforming the broad benchmark by at least 5-10% over the prior month.
- Validate volume trends showing increasing participation on up days and contracting volume during minor corrections.
- Enter positions only when multiple signals align across timeframes, and set stop-losses below recent swing lows or using ATR multiples for dynamic protection.
- Monitor ongoing performance weekly and rebalance when momentum indicators begin to deteriorate.
Real-World Examples from Recent Trends and 2026 Projections
During the 2024-2025 recovery phase, energy and financial sectors displayed strong MACD crossovers and RSI recoveries ahead of broad market gains, particularly following favorable earnings seasons. Traders who rotated into these areas ahead of key economic prints captured outsized returns. Similar patterns emerged in healthcare during policy-driven rotations in mid-2025, underscoring the value of multi-timeframe confirmation. Looking ahead to 2026, hypothetical scenarios include technology leadership reasserting during AI-driven growth phases if inflation remains contained, or a defensive rotation into utilities if growth slows. These examples illustrate how combining indicators with volume and relative strength creates robust entry points.
Comparing Indicator Effectiveness and Limitations
RSI excels at spotting short-term exhaustion points but can remain overbought during strong trending markets, leading to premature exits. MACD provides clearer trend-following signals yet lags during sideways consolidation periods. Combining both reduces whipsaws significantly. Backtests on sector ETFs indicate the dual approach improves win rates compared to single-indicator strategies. Traders should also consider adding Bollinger Bands or moving average crossovers as secondary filters for enhanced reliability across varying volatility regimes.
Common Mistakes to Avoid in Sector Rotation
- Over-relying on a single indicator without cross-confirmation from volume or relative strength.
- Ignoring broader economic context such as interest rate trends or geopolitical risks.
- Entering positions too early based on one bullish crossover without waiting for volume confirmation.
- Failing to adjust position sizes during high-volatility periods, leading to outsized drawdowns.
- Neglecting to review and adjust strategies after major market regime shifts.
Risk Management Checklists
- Limit any single sector allocation to 20-25% of the overall portfolio to maintain diversification.
- Use trailing stops tied to ATR (Average True Range) to protect gains while allowing room for normal fluctuations.
- Monitor correlation spikes between sectors during broad selloffs and reduce exposure accordingly.
- Reassess signals on a weekly basis rather than reacting to daily noise or headline events.
- Maintain cash reserves equivalent to 10-15% of the portfolio for opportunistic entries during volatility spikes.
- Document every rotation decision with supporting indicator readings for later review and refinement.
Frequently Asked Questions
How do I adapt strategies during high volatility?
Shorten RSI periods to 7-9 and tighten MACD settings for faster signals. Increase position sizing discipline, widen stops to account for larger swings, and reduce overall exposure until momentum stabilizes.
Which sectors typically lead in 2026?
Leadership depends heavily on growth, inflation, and monetary policy data. Technology and communication services often rotate into favor during expansionary phases, while staples, utilities, and healthcare provide defensive rotation during uncertainty or rising rate environments.
Can beginners use these tools effectively?
Intermediate traders benefit most because they understand false signal filtering and multi-timeframe analysis. Beginners should start with paper trading sector ETFs before committing real capital and consider educational resources from Federal Reserve for economic context.
Conclusion
Mastering momentum-based sector rotation in 2026 requires disciplined use of RSI, MACD, relative strength comparisons, volume analysis, and robust risk controls. By following the expanded step-by-step setups, checklists, and real-world examples outlined above, traders can position ahead of market trends while effectively controlling downside exposure. Continuous refinement through ongoing observation and backtesting remains essential for long-term success. For foundational economic data series, refer to resources at FRED.
No comments yet. Be the first!