 Bullish Portfolio
Introduction to Intermarket Analysis for 2026
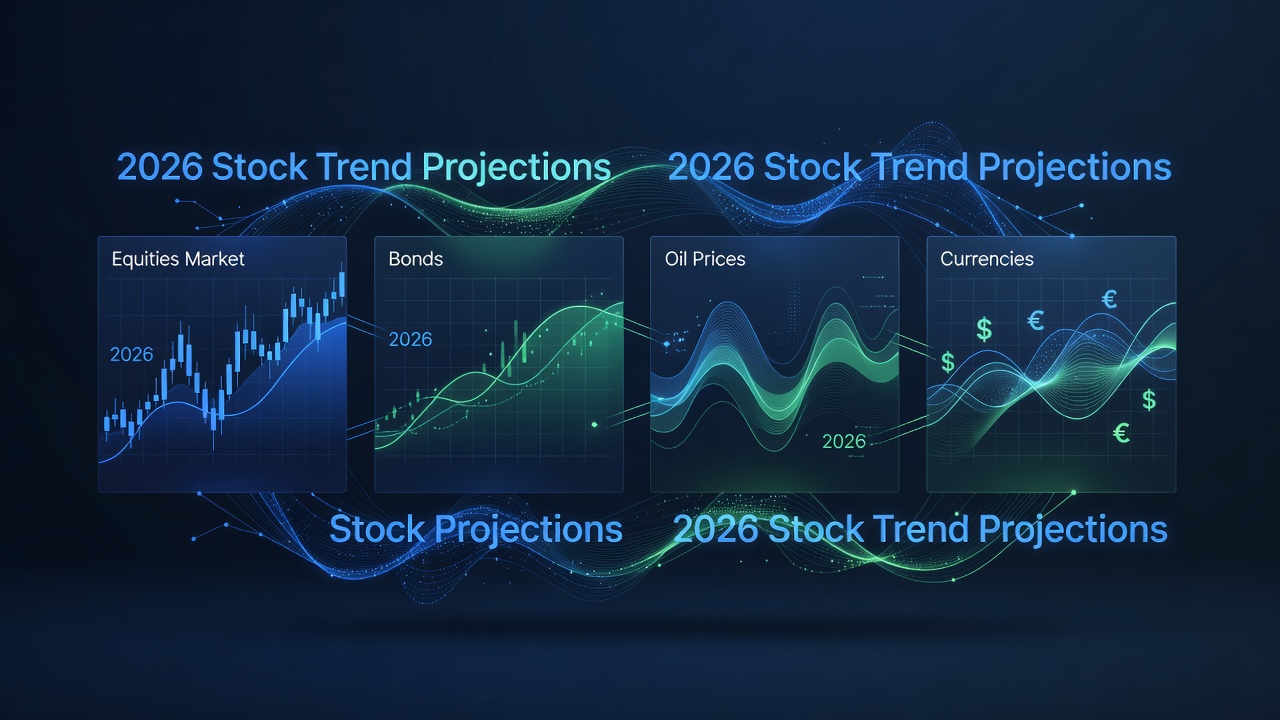
Intermarket analysis examines the dynamic relationships between major asset classes—equities, bonds, commodities, and currencies—to uncover broader market trends and predictive signals. For traders focused on 2026 stock market movements, this approach moves beyond isolated charts to reveal how shifts in one sector often foreshadow changes in another. By integrating these connections, investors gain context that single-asset technical analysis frequently misses. In 2026, economic transitions such as evolving monetary policies, global supply chain adjustments, and geopolitical factors make intermarket insights especially valuable for anticipating volatility in major indices like the S&P 500 and Nasdaq.
This comprehensive guide explores core principles, leading indicators like Treasury yields and oil prices, step-by-step correlation tracking, real-world examples, and practical tools for building effective dashboards. Traders who master these relationships can position themselves ahead of trend changes rather than reacting after the fact.
Core Relationships Between Asset Classes
Understanding how asset classes interact forms the foundation of intermarket analysis. Equities often move inversely to bonds during risk-on environments, while commodities like oil can influence currency values and inflation expectations that ripple into stock sectors. For instance, rising bond yields may pressure high-valuation growth stocks by increasing borrowing costs, while a weakening dollar can boost commodity exporters and multinational corporations.
Currencies play a pivotal role as well; a strengthening U.S. dollar may pressure commodity prices and emerging market equities. These linkages help identify turning points before they appear on individual stock charts. In 2026, with potential shifts in Federal Reserve policy, monitoring these interdependencies becomes crucial for avoiding surprises in equity performance across sectors such as technology, energy, and financials.
Identifying Leading Indicators: Treasury Yields and Oil Prices
Treasury yields serve as critical leading indicators. Rising 10-year yields can signal tightening financial conditions that eventually weigh on growth stocks. Oil prices similarly act as a barometer; sustained increases often precede inflationary pressures affecting consumer discretionary and transportation sectors. Traders tracking these in 2026 should monitor yield curve steepening alongside crude oil futures for early equity trend confirmation.
Additional leading indicators include copper prices for global growth signals and the Japanese yen for risk sentiment. By combining these with equity breadth measures, analysts can build a more robust framework for forecasting index direction.
Comparing Intermarket Analysis to Traditional Technical Analysis
Traditional technical analysis focuses on price patterns, volume, and indicators within a single asset. Intermarket analysis expands this by incorporating cross-asset data for higher-probability setups. For example, while a moving average crossover might suggest a stock buy signal, confirming it with bond yield stability and commodity trends reduces false positives. This layered approach proves superior during economic shifts when isolated signals can mislead investors into premature entries or exits.
Many professional traders combine both methods, using intermarket analysis for context and traditional tools for precise timing. The result is a more resilient strategy that accounts for macroeconomic drivers influencing 2026 stock trends.
Step-by-Step Correlation Tracking Methods
Follow these detailed steps to track correlations effectively:
- Select key instruments including major indices such as the Dow Jones and Russell 2000, Treasury ETFs like TLT, oil futures contracts, and the USD index.
- Use a 20- to 50-day rolling correlation window for timely insights while also reviewing longer 100-day periods for structural trends.
- Plot relationships on multi-chart layouts or specialized software platforms that allow overlay comparisons.
- Reassess weekly and adjust for regime changes like policy announcements or geopolitical events.
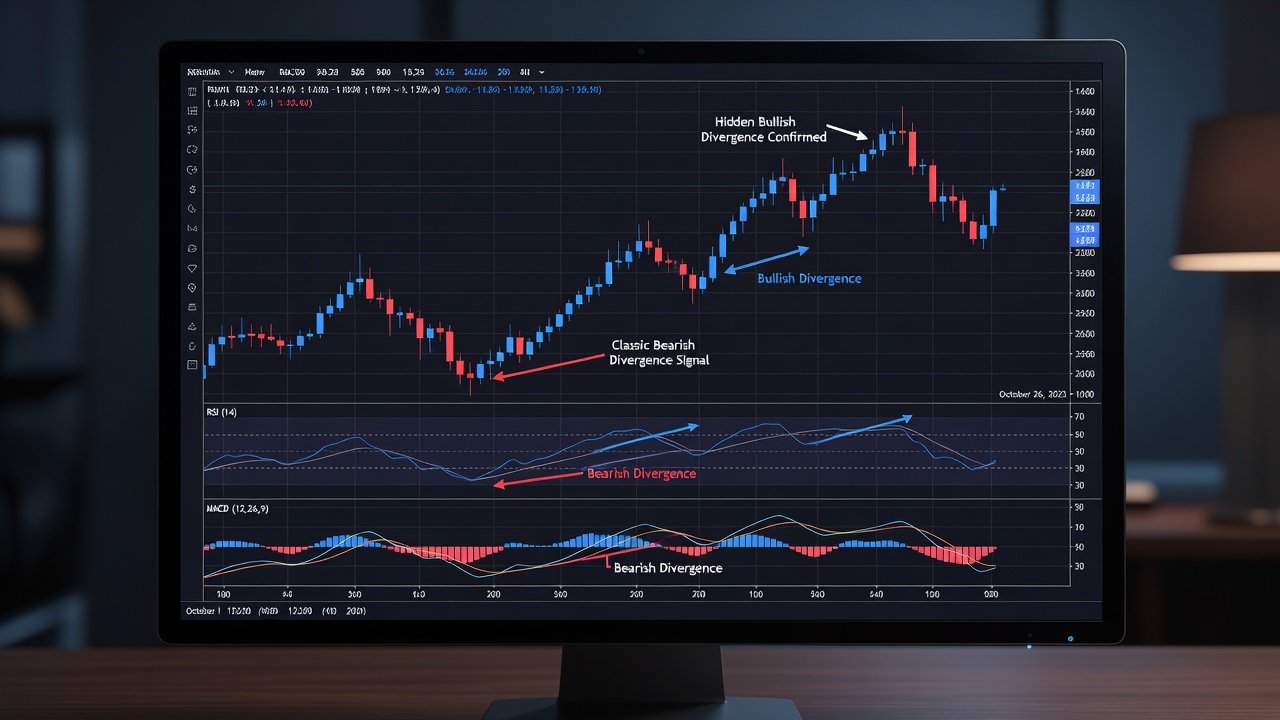
- Document divergences where one asset class breaks its historical pattern with others, as these often precede major equity reversals.
Regular practice builds intuition for divergence signals that precede reversals, helping traders avoid common traps during volatile 2026 periods.
Practical Checklist for Building Intermarket Dashboards
- Include real-time feeds for S&P 500, 10-year yields, WTI crude, and DXY with customizable alert thresholds.
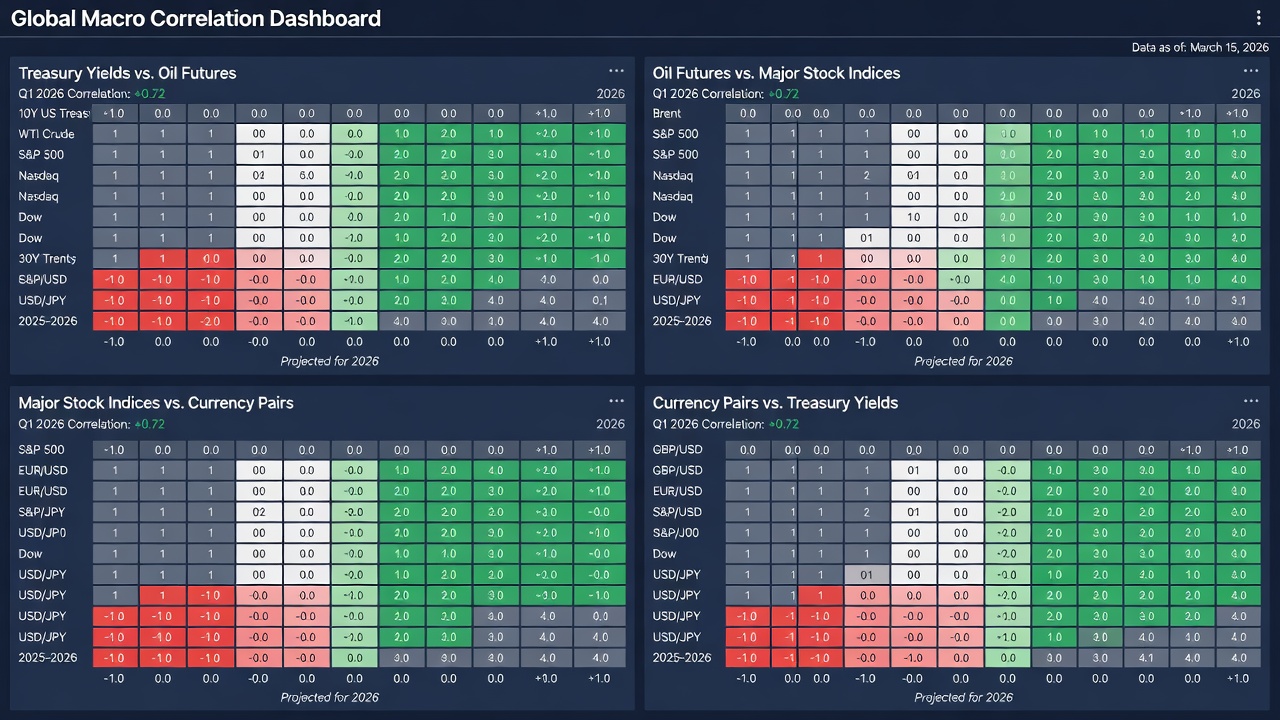
- Add correlation heatmaps updated daily to visualize strength and direction of relationships.
- Incorporate economic calendar overlays for context around key data releases.
- Set alerts for yield-oil divergences exceeding historical thresholds observed in the prior two years.
- Review dashboard weekly alongside broader market commentary from authoritative sources like the Federal Reserve.
- Backtest dashboard signals against past market cycles to refine accuracy before live use.
Real-World 2026 Examples from Major Indices
Consider hypothetical early-2026 scenarios where rising oil prices coincide with flattening yields, foreshadowing defensive rotations in the Nasdaq toward value stocks. Similar patterns observed historically illustrate how intermarket confirmation can guide position sizing ahead of index moves. Another example involves a weakening dollar paired with rising commodity prices, which could support cyclical sectors and small-cap equities in the Russell 2000 during the second half of the year.
These cases demonstrate the value of cross-asset confirmation when navigating uncertainty around inflation data or central bank decisions expected throughout 2026.
Mistakes to Avoid in Intermarket Analysis
Common errors include over-relying on short-term correlations that break during crises, ignoring time-zone differences in global markets, and failing to update models when economic regimes shift. Traders should also avoid confirmation bias by seeking disconfirming evidence from multiple asset classes before acting on a signal.
Common Pitfalls and FAQ
What causes false signals in intermarket analysis?
False signals often arise during rapid economic regime shifts when historical correlations temporarily break down. Always cross-verify with multiple timeframes and fundamental context from institutions such as the International Monetary Fund.
How many assets should a beginner dashboard track?
Start with four core classes and expand gradually to avoid information overload while maintaining focus on the most predictive relationships.
Is intermarket analysis suitable for all market conditions?
It excels in transitional periods but requires adjustments during strong trending markets dominated by one asset class. Combine with traditional analysis for best results.
Can intermarket analysis predict exact price targets?
No, it provides directional bias and timing clues rather than precise levels; use it alongside other tools for entry and exit decisions.
Conclusion
Intermarket analysis equips traders with a holistic view essential for navigating 2026 stock trends. By mastering correlations, leading indicators, and dashboard construction while avoiding common pitfalls, you can anticipate moves with greater confidence. Combine these techniques with ongoing education from sources such as the U.S. Securities and Exchange Commission to refine your edge over time and build a more robust trading process.
No comments yet. Be the first!