 Bullish Portfolio
Introduction to Technical Analysis in 2026
Technical analysis helps beginners understand stock market movements by studying price charts and patterns rather than company fundamentals. In 2026, with evolving market dynamics driven by technological shifts and global economic factors, mastering basic trend identification equips new investors with actionable skills for spotting opportunities and managing risk effectively. This guide focuses on core methods without advanced indicators, providing step-by-step processes, real-world examples from recent market behavior, and practical checklists to build confidence. Whether analyzing individual stocks or broader indices, technical analysis reveals buyer and seller behavior through visual data on charts. Start by recognizing that past price action often influences future movements due to collective market psychology and repeated patterns among participants.
Many beginners feel overwhelmed by charts at first, but breaking the process into simple steps makes it accessible. The goal is not to predict every move but to improve the probability of successful decisions by observing trends, key levels, and timing signals. Throughout 2026, markets have shown clear examples of how these basics apply across sectors like technology, healthcare, and energy.
Identifying Market Trends: The Foundation
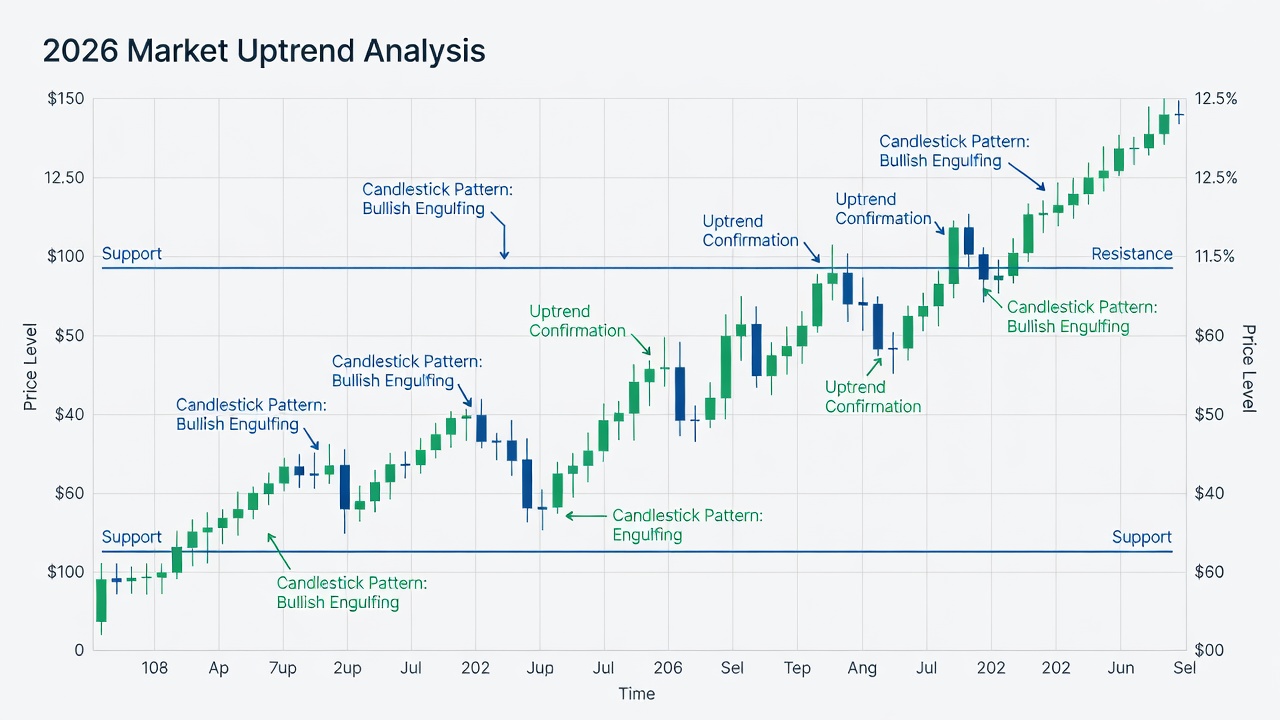
Market trends form the backbone of technical analysis. An uptrend shows higher highs and higher lows on a chart, signaling sustained bullish momentum where buyers consistently step in at higher prices. Conversely, a downtrend features lower highs and lower lows, indicating bearish pressure as sellers dominate. Sideways trends occur when prices move within a defined range without clear direction, often preceding a breakout.
To identify trends accurately, examine daily or weekly charts over several months rather than focusing on single days. Draw trendlines connecting successive swing lows in uptrends or swing highs in downtrends. In 2026 examples, consider how major technology stocks displayed sustained uptrends amid ongoing innovation cycles and AI advancements, while energy sectors fluctuated with supply chain developments and geopolitical events. Always verify the trend on multiple timeframes to avoid false signals from short-term noise. For instance, a daily chart might show an uptrend, but the weekly view could reveal a larger consolidation phase that affects overall strategy.
Support and Resistance Concepts Simplified
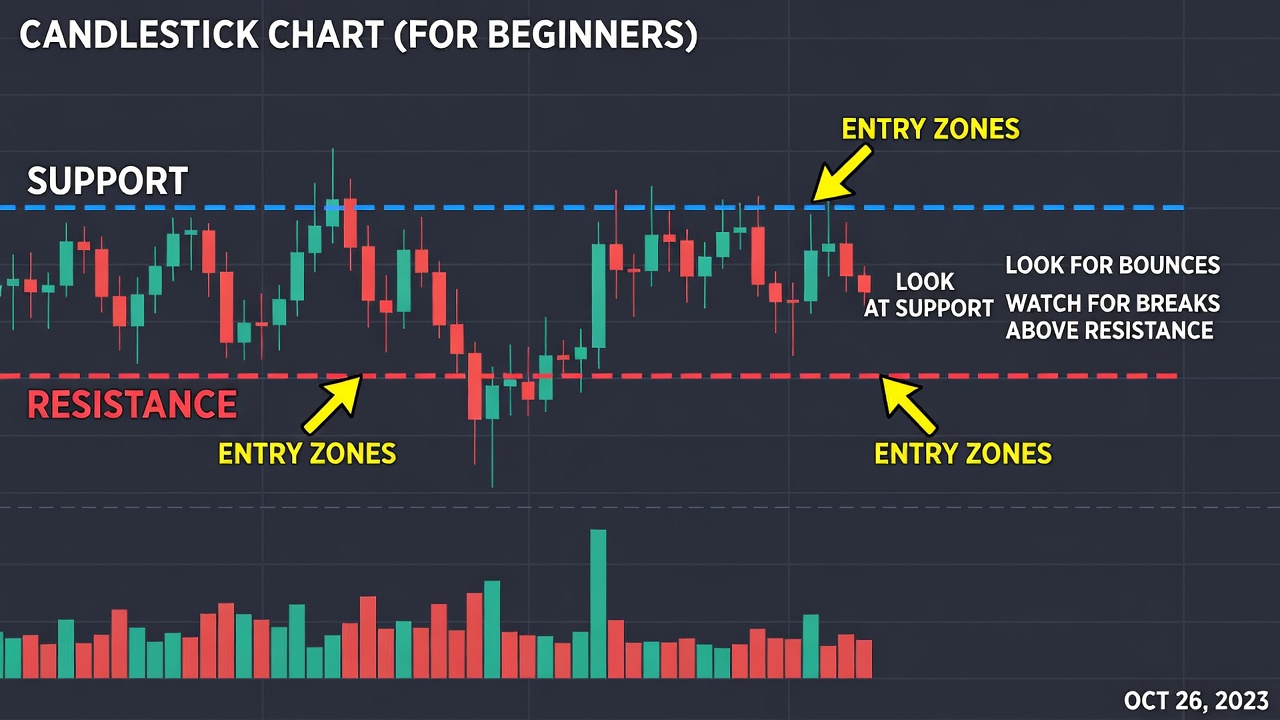
Support levels represent price zones where buying interest historically prevents further declines, acting as a floor. Resistance acts as a ceiling where selling pressure halts advances. These horizontal lines on charts help predict potential reversals or continuations when price tests them repeatedly.
Beginners should mark recent swing points on charts using previous highs and lows. When price approaches support in an uptrend, it may offer entry opportunities if accompanied by positive candlestick formations. Breaking through resistance can signal trend continuation, especially with increased trading activity. Always confirm these levels with volume increases for greater reliability, as low-volume breaks often fail quickly.
Step-by-Step Stock Chart Reviews
Follow this practical process for reviewing any stock chart effectively:
- Open a free charting platform and select a 6-12 month timeframe to capture meaningful price action without excessive noise.
- Identify the overall trend direction using trendlines and by counting higher highs or lower lows.
- Mark key support and resistance levels from past price reactions, noting how many times price has tested each zone.
- Observe candlestick patterns at these levels for clues on momentum shifts, such as dojis or engulfing candles indicating indecision or reversals.
- Assess volume to validate moves, ensuring rising volume accompanies significant price advances or declines.
- Compare the stock's behavior to related sector peers or major indices for broader context and confirmation.
Apply this method to 2026 market examples, such as reviewing a major index chart during periods of economic data releases to spot emerging trends early. This structured approach reduces guesswork and builds repeatable skills over time.
Timing Entries and Exits with Basic Methods
Effective entry timing involves waiting for price to pull back to support in an uptrend before buying, or waiting for a confirmed break above resistance. For exits, target the next resistance level in uptrends or support in downtrends while using recent swing points to set protective stops. This method helps avoid chasing prices and improves risk-reward ratios. In practice, combine these observations with patience, as entering too early often leads to unnecessary losses from minor fluctuations.
Comparing Uptrends and Downtrends
Uptrends reward patient traders who buy pullbacks near support and target resistance breaks for exits. Downtrends require greater caution, often favoring waiting for reversals at support rather than aggressive short positions unless clear confirmation exists. Key differences include slope steepness, duration, and volume characteristics—uptrends in growth sectors tend to last longer during favorable economic conditions, while downtrends can accelerate quickly on negative news. Practical tip: In uptrends, place stops just below recent lows; in downtrends, consider reducing exposure or shifting to defensive assets until clearer reversal signals appear on the charts.
Common Beginner Mistakes to Avoid
- Ignoring the broader trend and attempting to trade against it, which increases the chance of losses.
- Over-relying on single chart views without checking multiple timeframes for consistency.
- Entering trades without defined risk levels or stop-loss orders in place beforehand.
- Chasing breakouts without confirming volume support, leading to false signals.
- Letting emotions override chart signals during volatile 2026 periods driven by news events.
- Failing to review historical reactions at support and resistance, missing valuable context.
- Applying analysis only to one asset class instead of cross-checking related markets.
Practical Checklist for Trend Analysis
- Confirm trend direction with at least two higher timeframes before acting.
- Identify 2-3 support and resistance zones with clear historical tests.
- Check recent volume patterns to validate any potential moves.
- Define entry price, profit target, and stop-loss before considering any position.
- Review similar assets for correlation insights and overall market alignment.
- Document observations in a trading journal to track what works over multiple weeks.
FAQ: Starting Technical Analysis
How long does it take to learn basics?
With consistent practice on demo charts and real historical data, beginners can grasp fundamentals in 4-6 weeks while reviewing several charts daily.
Is technical analysis suitable for all markets in 2026?
Yes, it applies to stocks, indices, and other liquid assets, though always combine with sound risk management principles for sustainable results.
What tools do I need to begin?
Free platforms with basic charting tools suffice initially; focus on price action and volume rather than complex software features.
Can I use technical analysis alongside other approaches?
Absolutely, many investors combine chart patterns with basic fundamental reviews to strengthen overall decision making.
Conclusion
Building skills in technical analysis for 2026 trends starts with consistent chart review and disciplined application of support, resistance, and trend principles. Practice daily on various assets, review past trades honestly, and gradually incorporate these methods into your routine for improved decision-making. Authoritative resources like SEC.gov, FederalReserve.gov, and Investor.gov provide additional market context to complement your analysis efforts.
No comments yet. Be the first!