 Bullish Portfolio
Introduction to Seasonal Patterns in Stock Markets
Traders constantly seek edges in volatile markets, and seasonal patterns offer a unique calendar-based lens for analyzing 2026 stock market trends. These recurring behaviors, driven by economic cycles, investor psychology, and institutional flows, have shown persistence across decades. When combined with technical analysis, seasonal insights can refine entry and exit timing beyond pure indicator signals. Understanding these patterns helps traders anticipate periods of strength or weakness, allowing for better risk management and position sizing throughout the year. In 2026, with evolving macroeconomic conditions including potential shifts in interest rates and global trade dynamics, seasonal analysis gains added relevance as a complementary tool rather than a standalone strategy.
This guide explores how to identify major seasonal cycles, overlay them on price charts with volume confirmation, and evaluate performance across bull and bear regimes. Practical backtesting steps, 2026 index examples, and strategy comparisons are included to help traders build actionable setups. By the end of this article, readers will have a clear framework for integrating calendar-based analysis into their trading routines.
Identifying Major Seasonal Cycles
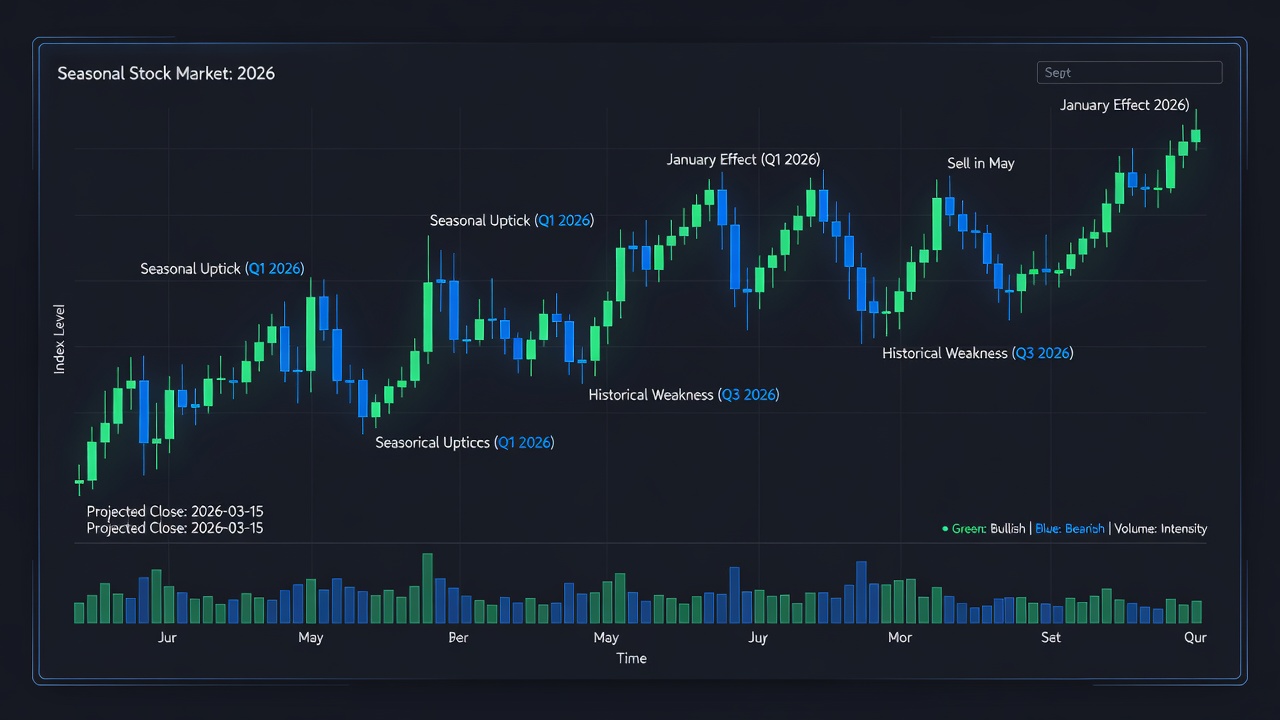
Seasonal cycles typically revolve around calendar events such as tax deadlines, earnings seasons, and holiday periods. Key patterns include the January effect, where small-cap stocks often rally early in the year due to year-end tax-loss harvesting and new portfolio allocations. The September-October weakness is another well-documented period associated with historical market corrections, often linked to fiscal year-end rebalancing by institutions. Summer months frequently exhibit lower volatility and subdued returns, known as the "sell in May and go away" phenomenon, while November and December tend to deliver positive performance as holiday spending and optimism build.
For 2026, monitoring these alongside Federal Reserve policy announcements will be essential. Traders should also consider presidential election cycles if applicable, though 2026 is a mid-term year that historically brings its own volatility patterns. Track multi-year data from major indices like the S&P 500 and Nasdaq to spot reliable windows. Overlaying historical averages reveals high-probability periods for bullish or bearish bias, but always validate with current economic data from sources such as the Federal Reserve.
Overlaying Seasonal Patterns on Price Charts with Volume Confirmation
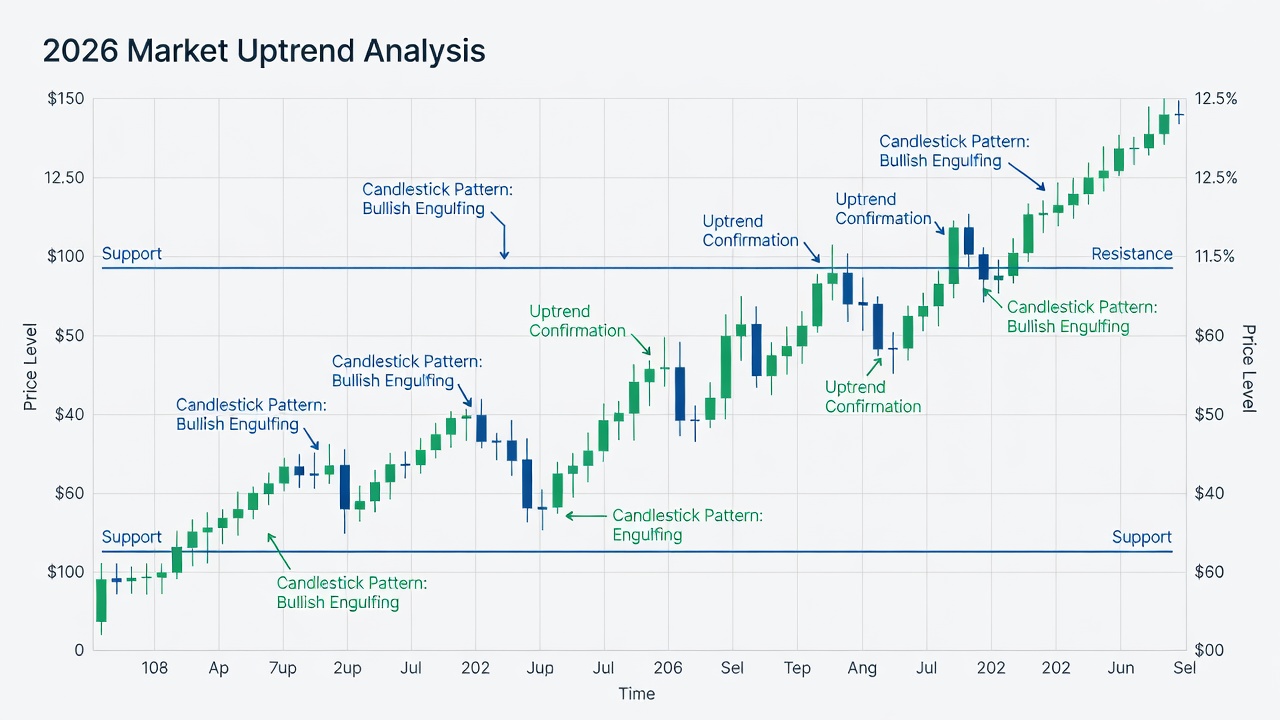
Effective use of seasonal data requires visual integration with candlestick charts and volume bars. Start by plotting average monthly returns from prior years onto current price action. Volume spikes during seasonal uptrends confirm institutional participation, while divergences signal potential false moves. Combine this with standard indicators like the 50-day and 200-day moving averages to identify confluence zones where seasonal bias aligns with technical support or resistance.
Traders can use charting platforms to create custom seasonal overlays that highlight expected return percentages for each month. When volume surges coincide with these windows, it strengthens the conviction for taking positions. This approach adds context to standard moving averages and RSI readings, helping traders avoid whipsaws in choppy conditions.

Comparing Performance Across Bull and Bear Regimes
Seasonal patterns behave differently depending on the broader market regime. In bull markets, positive seasonal windows tend to extend gains as momentum builds on favorable calendar periods. Bear markets, however, amplify downside during weak periods like September, making risk controls critical. Historical analysis shows that combining regime filters with seasonal timing improves risk-adjusted returns by reducing exposure during unfavorable seasons.
Traders can classify regimes using 200-day moving averages or economic indicators. In 2026, monitoring inflation reports and employment data will help determine whether the market is in expansion or contraction mode, allowing seasonal strategies to adapt dynamically.
Practical Steps for Backtesting Seasonal Setups
Backtesting is essential to validate seasonal ideas before live trading. Follow these detailed steps:
- Collect at least 10-15 years of daily index data from reliable providers, ensuring the dataset includes both bull and bear markets.
- Define seasonal windows based on historical averages, such as January 1-31 or September 1-October 31, and calculate average returns for each.
- Apply filters for volume and regime by requiring above-average volume on entry days and confirming the 200-day moving average direction.
- Run simulations on platforms supporting custom calendars, incorporating transaction costs and slippage to reflect real-world conditions.
- Evaluate metrics such as win rate, profit factor, maximum drawdown, and Sharpe ratio to assess overall robustness.
- Perform out-of-sample testing on the most recent 3-5 years of data to avoid overfitting to historical anomalies.
Document all assumptions and review results across multiple market environments for reliability.
Real-World 2026 Examples from Major Indices
Early 2026 data from the S&P 500 illustrated strong January performance aligned with seasonal norms, with the index gaining steadily in the first three weeks amid rising volume from institutional inflows. This provided clear long entry signals when price held above the 50-day moving average. Later in the year, September weakness provided short opportunities when price broke below key support with rising volume, consistent with historical patterns. The Nasdaq Composite showed similar behavior, with technology stocks leading the January rally before experiencing typical autumn pressure.
Similar patterns emerged in the Dow Jones Industrial Average, reinforcing the value of multi-index confirmation. Traders who waited for volume spikes during these windows achieved better timing than those relying solely on price action.
Seasonal vs Pure Indicator-Driven Strategies
Pure indicator strategies rely solely on momentum or mean-reversion signals, which can lag during regime shifts. Seasonal overlays add forward-looking context, often reducing false signals by highlighting periods where historical odds favor certain directions. However, indicators provide precise triggers that seasonal data alone cannot supply. The strongest results come from hybrid approaches that use seasonal bias for directional bias and indicators for exact entry timing.
Resources from the U.S. Securities and Exchange Commission offer regulatory context for interpreting institutional flows that drive many seasonal moves, while additional macroeconomic insights are available from U.S. Department of the Treasury.
Common Pitfalls to Avoid
Many traders over-optimize seasonal rules to fit past data, leading to poor forward performance. Another frequent mistake is ignoring volume confirmation, which can result in entries during low-liquidity periods prone to reversals. Failing to account for transaction costs or regime changes also erodes returns. Always maintain strict risk management with stop-loss orders and position sizing limits regardless of seasonal signals.
Conclusion
Seasonal patterns remain a powerful complement to technical analysis for navigating 2026 stock market trends. By following structured identification, overlay, and backtesting processes, traders gain a repeatable edge while managing risk across varying market regimes.
FAQ
What data sources are best for ongoing seasonal monitoring?
Reliable free sources include government economic calendars and major index providers. Cross-reference multiple datasets to confirm patterns and stay updated on any shifts in historical tendencies.
Can seasonal patterns fail in 2026?
Yes, external shocks or policy changes can disrupt historical tendencies. Always use stops and regime filters to protect capital when patterns deviate from expectations.
How many years of data are needed for reliable backtests?
At least 10-15 years provide statistical significance while capturing multiple market cycles, though extending to 20 years can offer even greater robustness for long-term validation.
Should seasonal analysis replace technical indicators entirely?
No, the most effective approach combines both. Seasonal data offers directional context while indicators deliver precise timing for entries and exits.
No comments yet. Be the first!