 Bullish Portfolio
Introduction to Divergence Trading in 2026 Markets
Divergence trading remains a powerful technique for anticipating shifts in stock trends, especially amid the volatility expected in 2026. By spotting discrepancies between price action and momentum oscillators, traders can identify potential reversals before they appear on standard charts. This guide provides practical, in-depth methods to detect both bullish and bearish divergences on daily and weekly timeframes, integrate confirmation signals, and apply disciplined risk management. Divergence analysis adds a layer of sophistication to technical trading by revealing when momentum is fading even as prices continue in their prior direction.
Understanding divergences helps forecast market moves across sectors. Whether analyzing tech giants or energy stocks during recent turbulent periods, the principles stay consistent while reliability varies by market conditions. In 2026, with potential shifts from economic policy changes and global events, mastering these patterns can give traders an edge in timing entries and exits more effectively than relying solely on trend lines or moving averages.
What Are Bullish and Bearish Divergences?
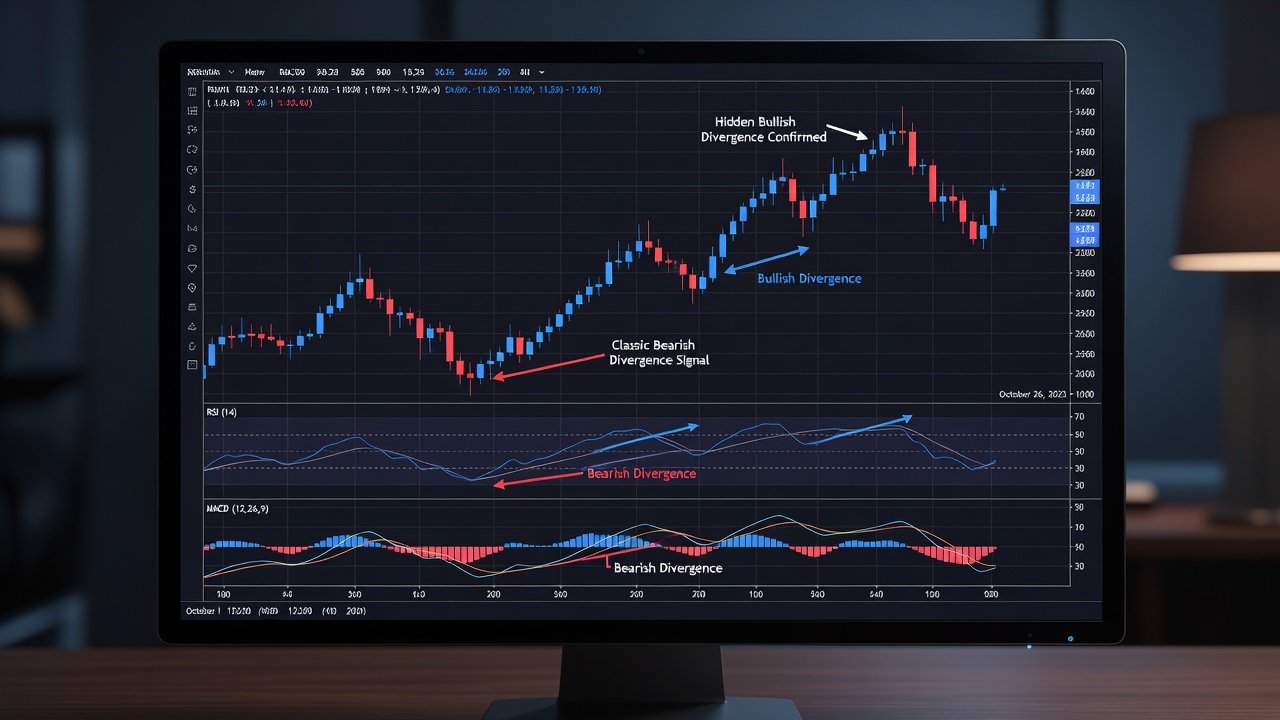
Bullish divergence occurs when price makes lower lows but an oscillator like RSI forms higher lows, signaling weakening downward momentum. Bearish divergence appears when price hits higher highs while the oscillator prints lower highs, hinting at fading upward strength. These patterns often precede trend changes but require careful validation to avoid false positives. Regular divergences point to potential reversals, while hidden divergences can signal trend continuation after a pullback.
Traders should differentiate between classic and hidden forms. Classic bullish divergence suggests a bottom may form, whereas hidden bullish divergence indicates the uptrend is likely to resume. The same logic applies inversely for bearish setups. Recognizing these distinctions improves decision-making when scanning multiple stocks daily.
Key Oscillators for Divergence Analysis
Popular tools include the Relative Strength Index (RSI) and Moving Average Convergence Divergence (MACD). RSI measures overbought or oversold conditions on a 0-100 scale, while MACD tracks the relationship between two exponential moving averages. Both excel at highlighting hidden momentum shifts on daily and weekly charts. The Stochastic oscillator also serves well for shorter-term divergences, particularly in ranging markets, because it reacts quickly to price changes.
Settings matter: a 14-period RSI is standard for daily charts, but some traders adjust to 9 or 21 for sensitivity. MACD defaults of 12,26,9 work across timeframes yet benefit from visual inspection of histogram bars for divergence confirmation. Combining two oscillators reduces noise and strengthens signals when they align.
Step-by-Step Detection on Daily and Weekly Charts
Begin by selecting a liquid stock with clear trend history. Plot the oscillator below the price chart. Scan for instances where price and oscillator move in opposite directions. On daily charts, divergences often resolve within days to weeks; weekly charts provide longer-term context and filter noise. Always compare multiple timeframes for alignment. Mark the exact pivot points on price and the oscillator to ensure the divergence is genuine rather than subjective.
Next, mark swing highs and lows on both price and oscillator. Confirm the divergence spans at least two comparable points. Add volume analysis to strengthen the signal—declining volume during the divergence phase often adds conviction. Review at least 50 bars of history to establish context and avoid isolated anomalies. For weekly charts, extend the lookback period to several months to capture major turning points.
Practical tip: use charting platforms that allow drawing tools directly on the oscillator pane for precise measurement. This step-by-step process builds consistency when applied across a watchlist of 20-30 stocks each weekend.
Confirmation Signals and Entry Rules
Never trade divergence alone. Wait for price to break a key support or resistance level, or for the oscillator to cross its signal line. Candlestick patterns such as engulfing bars or doji at the divergence point serve as additional triggers. For entries, place stop-loss orders beyond the recent swing extreme and target the next major support or resistance zone. Multiple confirmations, including a volume spike or moving average crossover, dramatically improve success rates.
Entry timing can be refined by waiting for the close of the confirmation candle rather than acting intraday. This reduces the impact of intrabar noise common in fast-moving 2026 markets.
Risk Management for Sustainable Trading
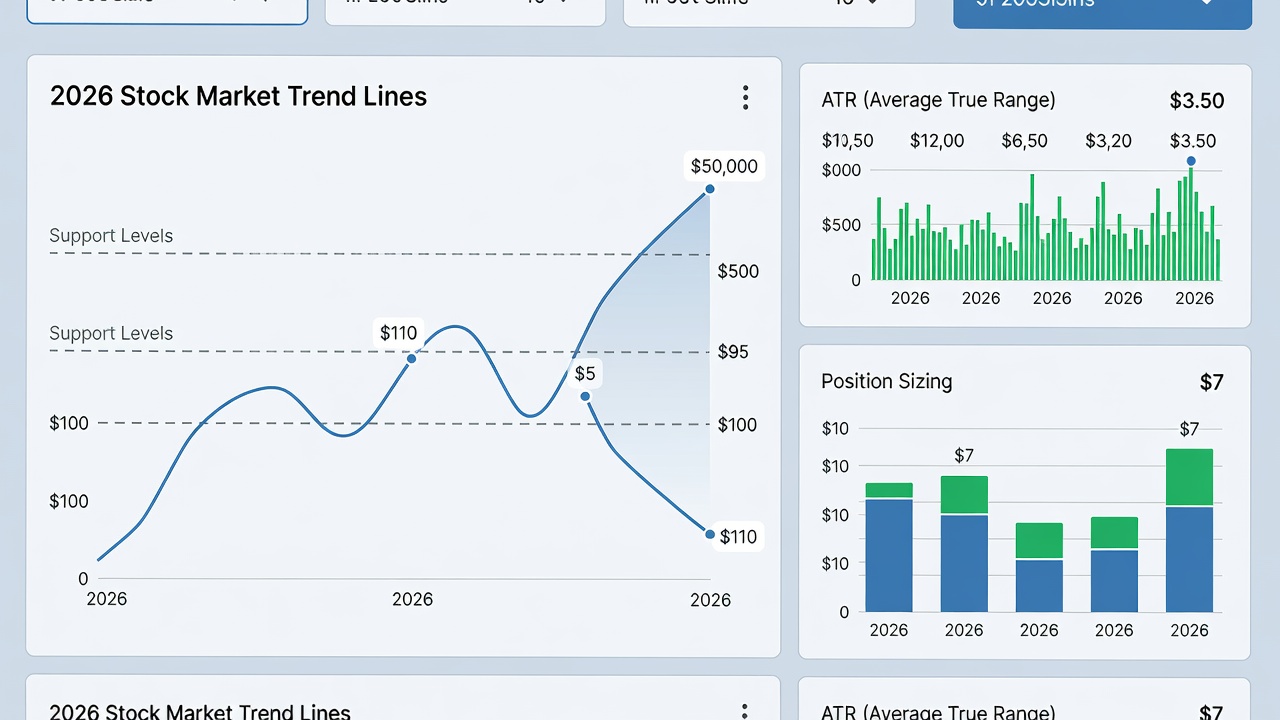
Position sizing should limit risk to 1-2% of capital per trade. Use trailing stops once the position moves favorably. Avoid over-leveraging during high-volatility periods common in 2026 forecasts. Regularly review trade journals to refine rules based on past outcomes. Incorporate a maximum daily loss limit and weekly drawdown threshold to protect overall portfolio health.
Advanced risk techniques include scaling into positions only after partial confirmation and using options for defined-risk entries when trading divergences on volatile names. These measures help preserve capital through inevitable losing streaks.
Real-World Stock Examples from Recent Volatile Periods
During the market swings of late 2025 into early 2026, several stocks displayed textbook divergences. A major semiconductor name showed bullish RSI divergence on the weekly chart ahead of a sustained rally, confirmed by MACD crossover. Conversely, an industrial sector leader exhibited bearish divergence on daily charts that preceded a sharp correction after earnings disappointment. Another example involved a consumer discretionary stock where hidden bearish divergence on the daily RSI warned of continuation lower despite a brief bounce.
These cases illustrate how divergences perform differently across market regimes. Reviewing historical charts of these episodes reveals that waiting for confirmation avoided several premature entries.
Comparing Divergence Reliability Across Sectors
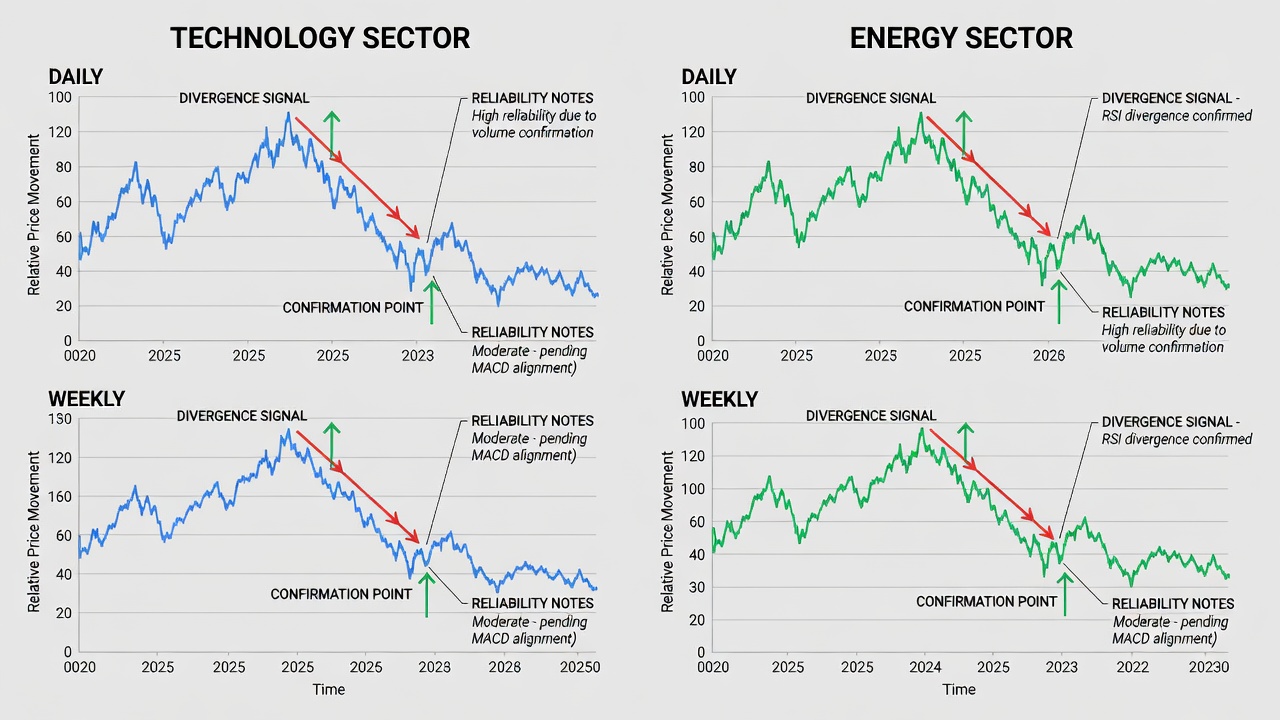
- Technology stocks often produce frequent but shorter-lived divergences due to rapid sentiment shifts.
- Energy and materials sectors tend to offer more reliable signals during commodity-driven cycles, with divergences aligning closely to fundamental inventory data.
- Consumer staples typically show subtler patterns but higher success rates in prolonged bear markets because of defensive characteristics.
- Financials can generate strong divergences around interest-rate announcements, though external policy news often overrides technical signals.
Common Pitfalls to Avoid
Many traders enter too early without confirmation, leading to whipsaws. Ignoring higher-timeframe context or failing to account for news events also reduces accuracy. Over-optimizing oscillator settings for past data frequently causes forward-looking failures. Another frequent mistake is neglecting liquidity; low-volume stocks produce unreliable divergences that fail to translate into meaningful price moves.
Traders should also avoid forcing signals in strong trending markets where momentum can remain divergent for extended periods without reversal. Maintaining a neutral mindset and strict checklist adherence helps mitigate these issues.
Practical Trader Checklist
- Identify clear price swings on the chosen timeframe.
- Confirm opposing oscillator movement with at least two points.
- Check alignment on a higher timeframe.
- Wait for price or oscillator confirmation before entry.
- Define stop-loss and target levels in advance.
- Assess sector-specific reliability factors.
- Document the setup and outcome for review.
- Review overall market breadth and major index divergences.
FAQ on Timing and False Signals
How long do divergences typically take to resolve?
Daily divergences often play out in 5–15 trading sessions, while weekly signals may require several weeks to months depending on broader market conditions.
What causes false divergence signals?
Strong trending markets with minimal pullbacks, sudden news catalysts, or low-volume environments frequently generate misleading divergences that fail to produce reversals.
Can divergences work in all market regimes?
They perform best in ranging or transitioning markets. Strong, uninterrupted trends can produce persistent divergences that remain unresolved for extended periods.
How should traders handle conflicting signals across timeframes?
Prioritize the higher timeframe divergence when daily and weekly signals disagree, then use the lower timeframe for precise entry timing only after the primary signal confirms.
Mastering divergence analysis equips traders with an edge for navigating 2026 stock trends when combined with rigorous confirmation and risk controls. Explore further resources at Investopedia, regulatory insights from SEC.gov, and policy updates via FederalReserve.gov to deepen your understanding.
No comments yet. Be the first!