 Bullish Portfolio

Introduction to Alternative Data Fusion in Trading
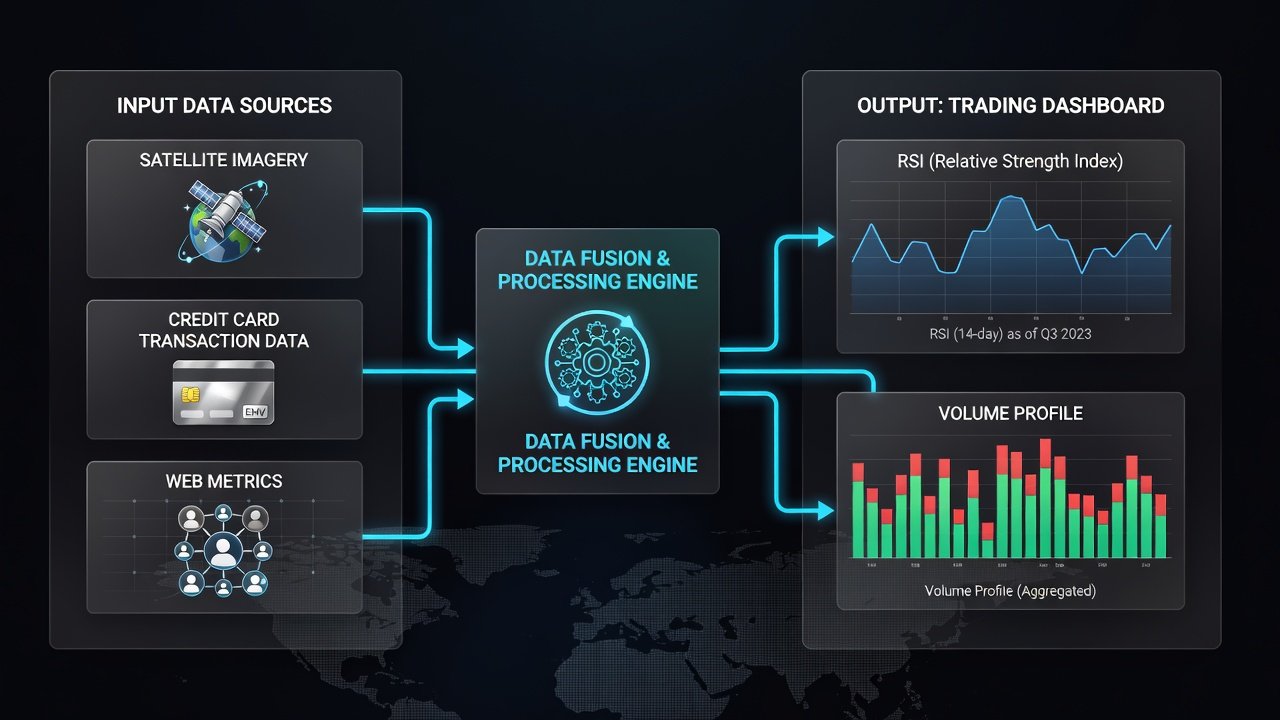
Traders seeking an edge in volatile markets are increasingly turning to alternative data fusion. This approach combines non-traditional signals like satellite imagery, credit card transaction flows, and web scraping metrics with established technical analysis tools such as the Relative Strength Index (RSI) and volume profile. For 2026 stock market trends, this hybrid method offers early detection of sector rotations and macroeconomic shifts that pure price-based analysis often misses. As markets become more efficient, relying solely on lagging indicators like moving averages or basic RSI readings leaves traders exposed to sudden reversals driven by underlying economic activity invisible on standard charts.
By layering these datasets, investors can validate technical signals and reduce false positives. This article explores practical sourcing, integration workflows, real-world examples, and common pitfalls to help you build a robust forecasting system that stands up to rigorous historical testing.
Sourcing Reliable Alternative Datasets
High-quality data is the foundation of any successful fusion strategy. Satellite imagery from providers like Planet Labs or Maxar Technologies tracks retail parking lot activity, agricultural yields, and supply chain movements with daily granularity. Credit card flows come from aggregated sources such as Second Measure or Earnest Research, revealing consumer spending patterns in real time across sectors like retail, travel, and dining. Web data includes job postings from Indeed, search trends via Google Trends API, and shipping container volumes scraped from logistics portals.
Always prioritize licensed, anonymized datasets to ensure compliance with privacy regulations. Cross-reference with official sources like SEC filings for validation of company disclosures. Start with free tiers or sample data before committing to paid subscriptions. For 2026 forecasting, focus on datasets updated at least weekly to capture emerging trends in consumer behavior and industrial output. Government resources such as Federal Reserve economic data can serve as benchmarks to calibrate alternative signals against broader macroeconomic indicators.
Integrating Alternative Signals with Core Technical Indicators
Integration begins by normalizing datasets into a unified time series aligned to market hours. Import satellite counts and credit card volumes into platforms like TradingView or Python-based environments using libraries such as pandas and TA-Lib. Overlay these on RSI (typically 14-period) and volume profile histograms to create composite indicators. For instance, a custom script might calculate a weighted average where satellite activity contributes 30% to a bullish score when it exceeds historical norms by two standard deviations.
For example, rising satellite activity in retail sectors combined with RSI above 50 and expanding volume nodes at key price levels can confirm bullish momentum. Use correlation scripts to align timestamps and filter noise with exponential moving averages. Advanced users can deploy machine learning models like random forests to identify non-linear relationships between alt data spikes and subsequent price movements.
Step-by-Step Example: Spotting Sector Rotation Early
Consider a detailed 2025-2026 energy-to-tech rotation scenario that illustrates the full workflow:
- Monitor satellite imagery showing declining oil rig activity and reduced truck traffic at energy hubs, signaling bearish fundamentals for the sector.
- Cross-check credit card data for increased tech hardware and software spending, indicating consumer and business shifts toward digital solutions.
- Validate with RSI divergence on energy ETFs dropping below 40 while tech ETFs show RSI climbing above 60, paired with rising volume profile nodes at tech support levels.
- Incorporate web data such as surging job postings in AI and cloud computing roles versus declining energy sector listings.
- Execute a small test position once order flow confirms the shift through increased buy-side volume in tech names.
- Monitor ongoing fusion scores daily and adjust stops based on continued alt data alignment.
This workflow spotted the rotation weeks ahead of price confirmation in historical backtests from 2022-2024 periods.
Validation Against Historical Price Action
Before live deployment, validate fused signals against multi-year price histories. Run backtests on 2018-2025 data across bull, bear, and sideways regimes. Measure metrics such as Sharpe ratio improvements and drawdown reductions. For example, a fused RSI-volume model might show 15-20% higher accuracy in predicting sector moves compared to standalone technicals during volatile periods like 2020 and 2022. Use walk-forward optimization to avoid lookahead bias and ensure robustness for 2026 projections.
Practical Tool Setups and Workflows
Use Python with APIs from Quandl, Snowflake, or AWS for scalable data ingestion and storage. Build interactive dashboards in Tableau or Power BI to visualize fused signals alongside live price feeds. For order flow integration, pair with Bookmap or Jigsaw Trading platforms that display footprint charts. Automate alerts via webhooks when alt data thresholds align with technical breakouts. Test thoroughly on historical 2020-2025 datasets to calibrate thresholds before moving to paper trading and then live deployment with small position sizes.
Addressing Data Noise and Common Pitfalls
Noise arises from seasonal biases in satellite data during holidays or incomplete credit card coverage in certain demographics. Mitigate by applying Kalman filters, z-score normalization, or ensemble averaging across multiple providers. Common pitfalls include over-reliance on single sources, ignoring latency issues in web scraping, and failing to account for corporate actions that distort volume profiles. Always require confluence across at least three independent signals and maintain a detailed trading journal to track signal performance over time.
Combining with Order Flow for Confirmation
Alternative data provides valuable macro context, while order flow offers micro-level confirmation through bid-ask imbalances and large block trades. Look for institutional footprints aligning with your fused signals, such as absorption patterns at volume profile highs. This dual approach filters out retail-driven noise and improves entry and exit timing, particularly during low-liquidity periods common in early 2026 sessions.
Comparison: Fused Approach vs Pure Technical Analysis
Historical analysis across multiple market cycles demonstrates that fused models consistently outperform pure RSI and volume profile strategies by capturing fundamental drivers earlier. Pure technical methods excel in ranging or mean-reverting markets but often lag during structural economic shifts driven by consumer spending changes or supply disruptions. The hybrid method typically delivers higher win rates and better risk-adjusted returns in trending environments expected through 2026, though it requires more infrastructure and ongoing data maintenance.
FAQ on Implementation Costs and Setup
- What is the typical learning curve for building these systems? Most traders with basic Python or spreadsheet skills adapt within 4-6 weeks using online tutorials and documentation from data providers.
- Are free datasets sufficient for serious backtesting? Sample data works well for initial testing and education, but production-grade forecasting requires paid feeds for timeliness and completeness.
- How do I validate results rigorously? Run walk-forward optimization on at least three distinct market regimes and track out-of-sample performance metrics like profit factor and maximum drawdown.
- What hardware or subscriptions are essential? A standard cloud instance and two to three data subscriptions typically suffice for individual traders starting out.
- Can this be scaled for portfolio management? Yes, by expanding to multi-asset dashboards and incorporating risk parity rules based on signal strength.
Conclusion
Alternative data fusion equips traders with a forward-looking lens for navigating 2026 stock market trends. By thoughtfully blending satellite imagery, credit card flows, and web signals with RSI and volume profile analysis, you gain a measurable advantage while managing risks through rigorous validation and order flow confirmation. Start small, iterate based on real performance data, and position yourself ahead of the curve as markets evolve.
No comments yet. Be the first!