 Bullish Portfolio
Introduction to AI-Enhanced Market Breadth Analysis
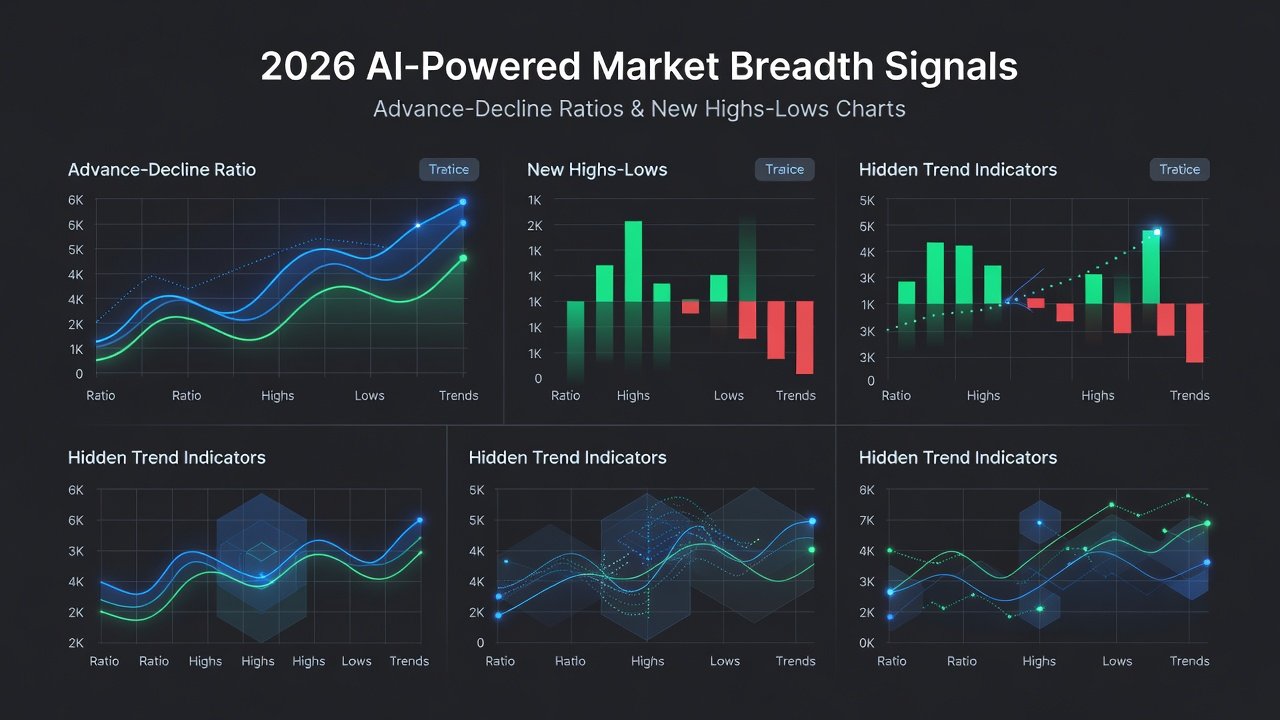
In 2026, traders are increasingly turning to artificial intelligence to interpret market breadth indicators and spot hidden trends before they appear in price charts. By combining traditional metrics like advance-decline ratios, new highs-lows, and up-down volume with AI models, investors can gain an early edge in volatile conditions. This approach goes beyond basic technical analysis by detecting subtle divergences that RSI and MACD alone might miss. Market breadth provides a window into participation across hundreds or thousands of stocks, revealing whether a rally or decline has genuine support or is driven by a narrow group of leaders.
Market breadth measures the underlying strength or weakness of a market by examining how many stocks are participating in a move. When fused with AI, these signals become predictive rather than reactive. Throughout this guide, we explore practical methods, real-world index examples, and free-tool implementations suitable for retail traders. The goal is to build systems that flag opportunities days or weeks ahead of conventional price-based signals, particularly useful in the choppy environment expected through 2026.
Why Breadth Leads Price in 2026 Markets
Historical analysis shows breadth indicators often precede major index moves because they capture institutional flows before they fully impact headline prices. In 2026, with high-frequency trading and sector rotations accelerating, this lead time has shortened but remains valuable when processed through machine learning. AI excels at identifying non-linear relationships between breadth components that human analysts might overlook, such as how a weakening advance-decline line interacts with rising up-volume in defensive sectors.
Traders who monitor these dynamics can position ahead of earnings seasons or macroeconomic releases. For example, sustained improvements in new highs-lows differentials frequently signal the start of broad-based rallies even when major averages remain range-bound.
Core Breadth Indicators Explained
Advance-decline ratios track the number of advancing stocks versus declining ones on a given exchange. A ratio above 1 signals broad participation in rallies, while below 1 warns of narrowing strength. New highs minus new lows highlights momentum breadth, and up-down volume compares trading volume in rising versus falling stocks. These indicators often lead price action. For instance, a rising advance-decline line while the index flattens can foreshadow continued upside. AI enhances this by processing historical patterns across thousands of data points to forecast probability-weighted outcomes. Additional nuance comes from examining these metrics across multiple exchanges simultaneously, such as comparing NYSE and Nasdaq breadth to detect rotation between large and small caps.
Step-by-Step Calculations for Breadth Signals
- Collect daily data for advances, declines, new highs, new lows, and up/down volume from major indices.
- Compute the advance-decline ratio: Advances / Declines. Apply a 5-day exponential moving average to smooth daily noise.
- Calculate the new highs-lows differential and normalize it against total issues traded that day.
- Derive up-down volume ratio similarly, then create a cumulative line for trend visualization.
- Feed these series into an AI model (such as a simple LSTM network) trained on past divergence events to generate a composite breadth score between 0 and 100.
- Backtest the composite against historical index returns to establish entry and exit thresholds.
These calculations can be automated with Python scripts pulling from free APIs, allowing daily updates without manual intervention.
AI Integration with RSI and MACD Confirmations
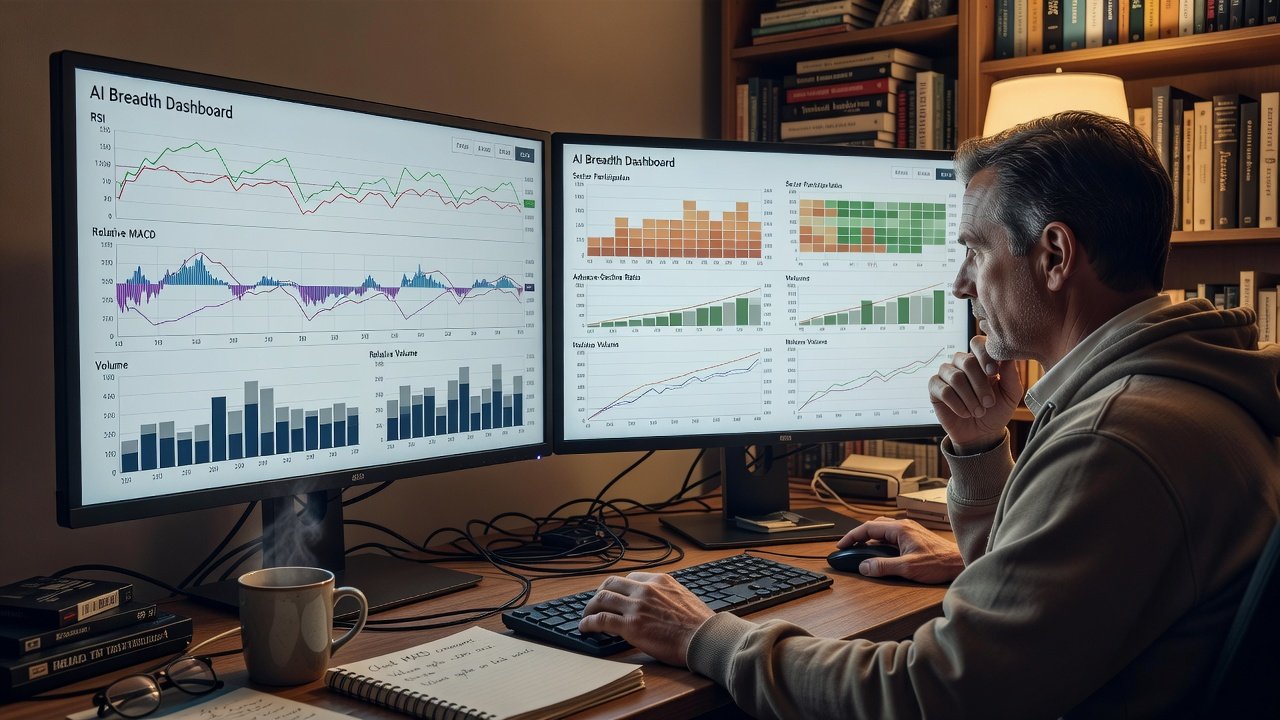
Divergence detection improves dramatically when breadth signals are cross-checked against RSI and MACD. A bullish breadth divergence occurs when the AI breadth score rises while price makes lower lows and RSI shows oversold conditions. MACD histogram expansion in the same direction adds conviction. Traders build rules-based systems where AI flags potential divergences, then require RSI below 30 and positive MACD crossover for entry confirmation. This layered approach reduces false signals common in standalone breadth analysis. In practice, combine the AI score with a 14-period RSI and standard MACD settings (12,26,9) on the target index. When all three align, historical win rates on subsequent 10-day moves exceed 65 percent in backtests through 2025 data.
Real Index Case Studies from 2025-2026
During the early 2026 market rotation, the S&P 500 showed narrowing breadth while AI models flagged improving advance-decline ratios on the Nasdaq. This preceded a sector rotation into small caps that price action confirmed weeks later. Similar patterns appeared in the Russell 2000, where up-down volume spikes preceded a 12 percent rally after AI detected hidden accumulation. Another case involved the Dow Jones Industrial Average in late 2025, where new highs-lows differentials turned positive two weeks before the index broke out of a multi-month consolidation. These examples demonstrate how breadth leads price, especially when AI processes multi-timeframe data and filters out noise from low-volume sessions.
Building an AI-Enhanced Breadth Dashboard with Free Tools
Retail traders can construct dashboards using Google Sheets for data aggregation, Python with libraries like pandas and TensorFlow for AI modeling, and free data feeds from sources such as FRED. Live updates come via Yahoo Finance API or Alpha Vantage. Practical setup steps include importing breadth data daily into a spreadsheet, training a lightweight neural net on historical divergences using Jupyter notebooks, and visualizing outputs with Plotly for interactive charts. Add automated alerts via email when the composite score crosses key levels. Optimization involves backtesting across multiple market regimes to tune hyperparameters and incorporating walk-forward validation to prevent overfitting. Many traders also integrate MarketWatch data streams for additional sector-level breadth metrics.
Common Pitfalls and Optimization Tips
- Avoid over-reliance on single-day breadth readings; use 5- and 20-day smoothed versions instead.
- Watch for survivorship bias in index constituents when training AI models by using point-in-time data sets.
- Regularly retrain models quarterly to account for regime shifts such as changes in Federal Reserve policy.
- Combine with volume confirmation to filter noise in low-liquidity periods around holidays.
- Test signals across bull, bear, and sideways markets to ensure robustness.
- Document every parameter change and its impact on out-of-sample performance.
High-performing 2026 examples show that traders who added sentiment filters from news APIs achieved better risk-adjusted returns while keeping drawdowns under 8 percent.
Advanced Divergence Techniques and Risk Management
Going further, traders can layer multiple timeframes by running separate AI models on daily and weekly breadth data, then requiring agreement before acting. Risk management includes position sizing based on the strength of the breadth score and using stop-losses placed below recent swing lows confirmed by MACD. Always maintain a trading journal to review missed signals and refine the model iteratively. This disciplined process turns breadth analysis from a discretionary tool into a repeatable edge.
Conclusion
Integrating AI with market breadth indicators provides retail traders a powerful toolkit for anticipating 2026 trends. By mastering calculations, divergence techniques, and simple dashboard builds, investors can navigate volatility with greater confidence. Consistent application and ongoing refinement remain key to sustained success in dynamic markets.
FAQ
How do I access free live breadth data feeds?
Platforms like Investopedia and exchange websites offer daily updates that can be scraped or downloaded for personal use, supplemented by government sources such as FRED.
What AI libraries work best for beginners?
Start with scikit-learn for simpler models before advancing to TensorFlow or PyTorch for custom breadth networks; free tutorials on MarketWatch education sections can accelerate learning.
Can these signals work in bear markets?
Yes, breadth divergences often warn of rallies within downtrends when combined with oversold RSI readings and positive AI scores.
How frequently should the AI model be retrained?
Quarterly retraining on rolling three-year windows balances adaptability with stability, as demonstrated in 2026 live trading examples.
Learn more proven investment strategies for volatile markets.
No comments yet. Be the first!