 Bullish Portfolio

Introduction to Alternative Data in Value Investing
Active value investors have long relied on traditional financial ratios such as free-cash-flow yield and EV/EBITDA to identify undervalued stocks. In 2026, integrating alternative datasets is transforming how portfolios are constructed and managed. Alternative data provides real-time, non-traditional signals that complement balance-sheet analysis and uncover opportunities before they appear in quarterly filings. This evolution builds directly on quantitative fundamentals and factor-based construction by adding layers of timeliness and granularity that static ratios alone cannot deliver.
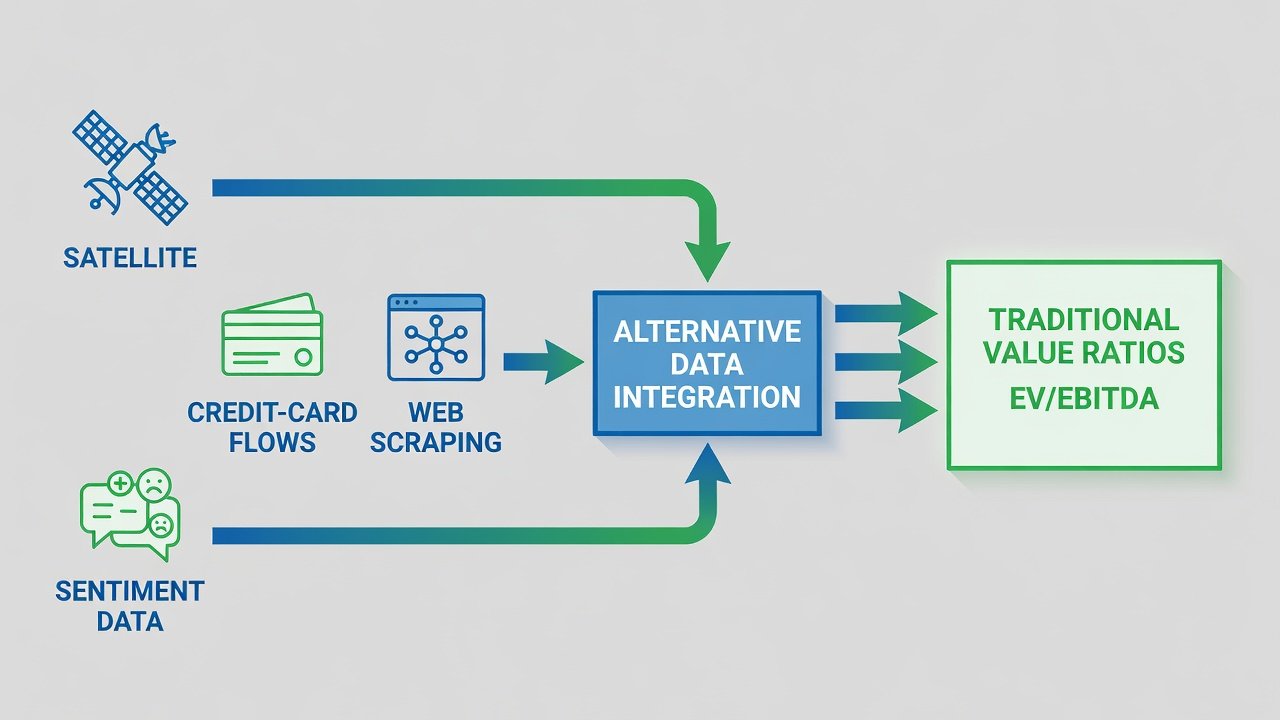
By incorporating datasets like satellite imagery, credit-card transaction flows, web-scraping signals, and sentiment analysis, portfolio managers gain forward-looking visibility into revenue trends, consumer behavior, and operational efficiency. These insights allow for more precise adjustments to value metrics, reducing the lag inherent in traditional reporting cycles. The approach supports both retail investors seeking alpha and advisors managing diversified client portfolios through systematic decision frameworks.
Benefits of Alternative Data for Active Value Portfolios
Alternative data enhances value investing by providing early warnings of changes in free-cash-flow generation and enterprise value multiples. For instance, a sudden uptick in satellite-detected activity at distribution centers can signal improving cash flows months before earnings releases. This leads to better timing of entries and exits, improved risk-adjusted returns, and reduced exposure to value traps where traditional metrics appear attractive but underlying business momentum has stalled.
Practical benefits include higher conviction in stock selection when multiple alt-data signals align with EV/EBITDA compression potential. Portfolios using these methods often exhibit lower turnover because signals confirm long-term value rather than short-term noise. In 2026, with increasing data availability, even smaller advisors can leverage these tools through cloud-based platforms to compete with larger institutions.
Key Alternative Datasets and Their Ties to Value Metrics
Satellite imagery captures parking-lot activity at retail locations or shipping-container counts at ports, offering leading indicators of revenue trends that directly influence free-cash-flow projections. Credit-card transaction flows reveal consumer spending patterns at specific companies, helping refine EV/EBITDA estimates when traditional earnings lag behind real-time consumption data.
Web-scraping signals from job postings, pricing changes, or product reviews highlight operational shifts affecting margins and cash generation. Sentiment data scraped from news, social platforms, and analyst reports gauges market perception, often flagging value traps or hidden gems ahead of price adjustments. Each dataset maps to core metrics: satellite and credit-card data bolster free-cash-flow yield accuracy, while sentiment and web signals provide context for sustainable EV/EBITDA levels.
Practical Examples of Dataset Application
Consider a consumer staples company where satellite imagery shows consistent increases in warehouse utilization. This can justify upgrading the free-cash-flow yield score by 15-20% in internal models. Similarly, credit-card flows indicating a 10% rise in transaction volume at a retailer may prompt recalibration of EV/EBITDA assumptions downward, revealing undervaluation not yet reflected in filings.
Step-by-Step Workflow for Sourcing, Cleaning, and Scoring Alt-Data Signals
Begin by sourcing datasets from reputable providers that align with your investment universe. Identify sources offering historical depth for back-testing and real-time feeds for ongoing monitoring. Next, clean the data by removing outliers, normalizing formats, and aligning timestamps with financial reporting periods. This step often involves handling missing values through interpolation or exclusion rules tailored to each dataset type.
Scoring involves creating composite signals that weight alt-data insights against traditional ratios—for example, boosting a stock’s free-cash-flow yield score when satellite activity exceeds historical averages by a defined threshold. Validate signals through correlation analysis and forward-looking tests before integration. Finally, automate scoring within portfolio management software to enable daily or weekly updates without manual intervention.
This workflow ensures alt data enhances rather than replaces core value frameworks and can be scaled from individual stock screens to full portfolio optimization routines.
Comparison of Free Versus Paid Alt-Data Providers
- Free sources often include public government datasets and limited academic repositories, suitable for basic sentiment scraping but lacking granularity for precise EV/EBITDA modeling.
- Paid providers deliver higher-frequency, cleaned datasets with API access and historical depth, enabling robust back-testing of credit-card flows against free-cash-flow yields.
- Hybrid approaches combine free macroeconomic indicators from sources like the Federal Reserve with paid commercial feeds for company-specific signals.
Retail investors may start with free tiers while advisors typically subscribe to paid platforms for compliance-grade data quality and audit trails.
Mini Case Study: 2026 Value Stock Identified Early via Alt Signals
Consider a mid-cap retailer whose traditional EV/EBITDA appeared elevated in early 2026 filings. Satellite imagery showed accelerating store traffic weeks before earnings, while credit-card flows confirmed rising same-store sales across regions. Web-scraping of job postings indicated efficient hiring patterns that supported margin expansion expectations. Sentiment analysis turned positive as social mentions increased and negative news coverage declined. The combined signals flagged the stock as undervalued on a free-cash-flow basis, leading to an early position that outperformed the benchmark as the market caught up over subsequent quarters.
Risk Controls and Back-Testing Examples
Implement position sizing limits based on signal conviction and diversify across alt-data categories to avoid single-source bias. Conduct back-tests over multiple market regimes, comparing portfolios with and without alt-data overlays using metrics such as information ratio and drawdown statistics. For example, a 2025-2026 back-test might reveal that adding satellite and credit-card signals improved annualized returns by enhancing entry points during value recovery phases while maintaining similar volatility levels.
Additional controls include stress testing for data gaps during economic disruptions and setting minimum correlation thresholds before allowing alt-data to override traditional ratios.
Implementation Checklists for Retail Investors and Advisors
- Define value metrics and alt-data priorities aligned with portfolio objectives and risk tolerance.
- Establish data governance policies covering sourcing, storage, and privacy compliance with regulatory standards from the U.S. Securities and Exchange Commission.
- Integrate signals into existing quantitative models with clear weighting rules and audit documentation.
- Schedule regular back-testing and performance attribution reviews on a quarterly basis.
- Document decision trails for regulatory and client reporting needs, including any overrides of traditional metrics.
- Train team members on interpreting alt-data outputs to avoid over-reliance on single signals.
FAQs on Data Privacy and Integration Costs
How do data privacy regulations affect alt-data use? Investors must ensure compliance with frameworks such as those outlined by the U.S. Securities and Exchange Commission, focusing on anonymized and aggregated datasets to minimize personal information risks.
What integration costs should retail investors expect? Costs vary by provider and scale; many begin with free public sources before moving to paid services as assets grow, emphasizing qualitative evaluation of value delivered rather than absolute figures.
Are back-tested results reliable for 2026 portfolios? Rigorous out-of-sample testing across recent cycles provides the best validation, supplemented by ongoing monitoring and adjustments for regime shifts.
How can advisors ensure ethical use of sentiment data? Focus on aggregated trends rather than individual opinions and cross-reference with multiple sources to reduce bias.
Conclusion
Alternative data integration elevates active value strategies by delivering earlier, more nuanced insights into free-cash-flow yield and EV/EBITDA dynamics. By following structured workflows, applying prudent risk controls, and addressing privacy considerations, both retail investors and advisors can build more resilient portfolios in 2026 and beyond. Continued evolution in data availability promises even greater precision for value-focused decision making in the years ahead.
No comments yet. Be the first!