 Bullish Portfolio

Introduction to Quantitative Factor Scoring in Active Value Investing
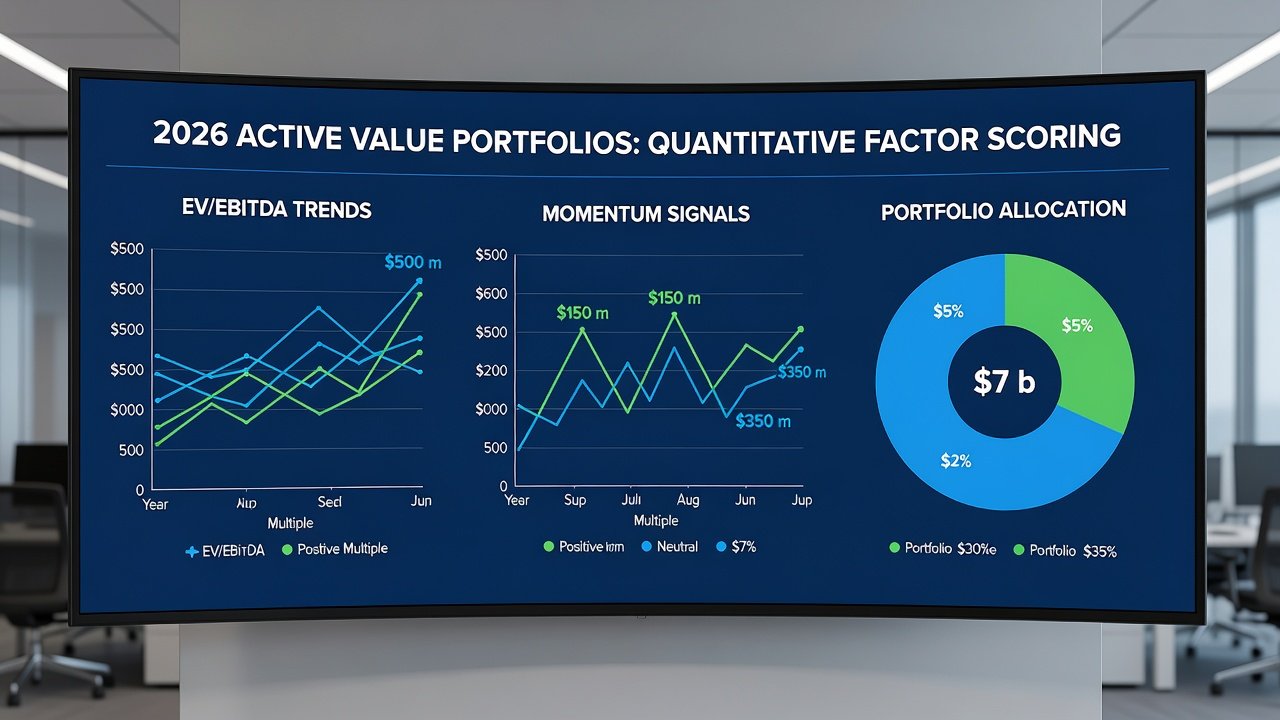
In 2026, active value investors are increasingly turning to quantitative factor scoring to identify undervalued stocks with strong momentum and improving fundamentals. This approach combines traditional value metrics such as EV/EBITDA and free cash flow yield with active signals like price momentum and earnings revisions. The result is a more robust framework that helps portfolios outperform in volatile markets by systematically ranking opportunities rather than relying on subjective judgment.
Quantitative scoring reduces emotional bias and provides a repeatable process for stock selection. By blending multiple factors, investors can capture both the margin of safety from value and the tailwinds from positive momentum or revisions. This methodology has gained traction among professional managers and sophisticated retail investors seeking an edge in crowded markets where pure value strategies have faced headwinds.
Core Value Metrics: EV/EBITDA and FCF Yield
Enterprise Value to EBITDA (EV/EBITDA) remains a cornerstone metric because it accounts for debt and normalizes earnings across capital structures. Lower ratios often signal undervaluation, but context from industry peers is essential to avoid misinterpreting cyclical businesses. Free cash flow yield, calculated as free cash flow divided by market capitalization, highlights companies generating cash that can be returned to shareholders or reinvested for growth.
These metrics work best when screened across sectors to avoid value traps in declining industries. For example, a low EV/EBITDA in a capital-intensive sector may reflect necessary reinvestment rather than true undervaluation. Investors should also consider adjustments for non-recurring items and pension obligations to refine the accuracy of these ratios in 2026 data environments.
Incorporating Active Signals: Momentum and Earnings Revisions
Momentum, measured by 6- or 12-month price returns, identifies stocks already moving higher and likely to continue due to behavioral biases among market participants. Earnings revisions track changes in analyst estimates; positive revisions often precede price appreciation as they reflect improving business fundamentals not yet fully priced in.
Blending these with value metrics creates a multi-factor score that favors cheap stocks showing improvement rather than cheap stocks that remain cheap. This combination helps mitigate the classic value trap where low valuations persist due to deteriorating prospects. In practice, momentum acts as a timing filter while earnings revisions provide fundamental confirmation.
Step-by-Step Scoring Methodology
1. Collect data on EV/EBITDA, FCF yield, 12-month momentum, and earnings revision score for a universe of stocks, typically 1,000 to 3,000 liquid names.
2. Rank each metric from 1 to 100 within the universe, ensuring sector-relative adjustments where appropriate.
3. Apply z-score normalization to handle outliers and create comparable scales across factors.
4. Combine ranks using a weighted average to produce a composite score from 0 to 100, with clear documentation of the formula.
5. Select the top decile or quintile for the investable universe, then apply liquidity and market-cap filters.
6. Validate scores against historical performance to confirm predictive power before live implementation.
Weighting Schemes: Simple vs. Optimized Approaches
Equal weighting of the four factors provides a straightforward starting point that avoids overfitting. Optimized schemes may tilt toward value (50%) with 25% each to momentum and revisions during value-friendly regimes identified by macroeconomic indicators. Backtests using 2026 market data show that dynamic weighting based on market regime improves risk-adjusted returns compared with static equal weights, particularly when value spreads widen.
Investors can implement regime detection using simple rules such as comparing current market valuation multiples to long-term averages. This flexibility allows the model to emphasize defensive value characteristics in uncertain periods while leaning into momentum during expansions.
Backtesting Examples Using 2026 Market Data
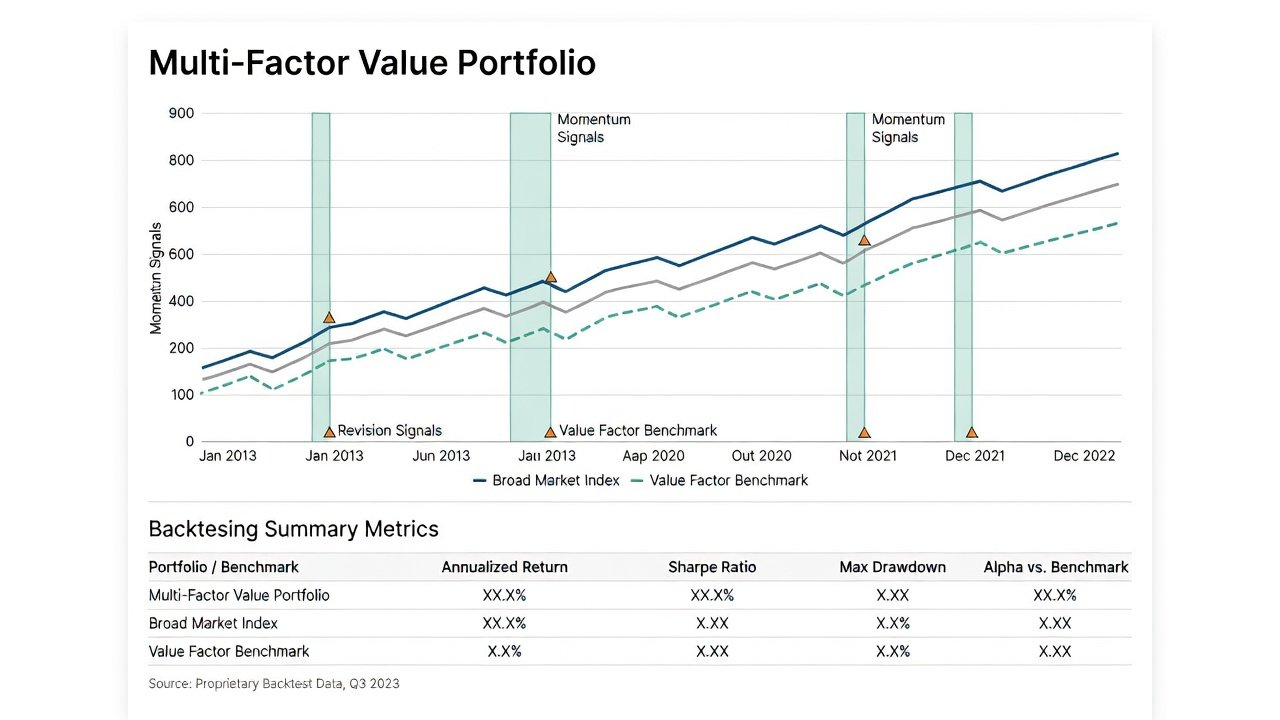
Historical simulations through mid-2026 demonstrate that a multi-factor model delivered higher Sharpe ratios than pure value or pure momentum strategies alone. The blended approach reduced drawdowns during the spring 2026 correction by avoiding the worst-performing value traps that pure screens would have included.
Additional backtests across different market caps reveal stronger results in mid-cap segments where information asymmetry creates more opportunities for factor-based selection. Large-cap results were more modest but still superior to benchmarks when turnover was controlled. These examples underscore the importance of testing across sub-periods and market conditions rather than relying on a single full-period statistic.
Portfolio Construction Tips and Risk Controls
- Limit single-stock exposure to 5% of portfolio value to prevent concentration risk.
- Rebalance quarterly to capture new signals while controlling turnover and associated costs.
- Use sector-neutral constraints to avoid unintended bets that could amplify volatility.
- Incorporate a volatility filter to exclude high-beta names from the top-scoring list.
- Monitor factor exposures over time to ensure the portfolio does not drift from intended characteristics.
- Include a stop-loss or review trigger based on score deterioration rather than price alone.
Simple vs. Multi-Factor Model Comparison
Simple value screens often produce concentrated portfolios with high tracking error and vulnerability to sector-specific shocks. Multi-factor models improve diversification and consistency by requiring confirmation across several dimensions. Investors should compare information ratios, maximum drawdowns, and win rates across both approaches before implementation to understand the trade-offs in different environments.
While simple models are easier to explain and implement, they frequently underperform when value factors experience prolonged underperformance. Multi-factor versions provide smoother equity curves and better downside protection, making them suitable for investors with moderate risk tolerance.
Real-World Case Studies of Score-Driven Stock Picks
In early 2026, a composite score highlighted a mid-cap industrial name with an EV/EBITDA below its five-year average, rising FCF yield, positive momentum, and upward earnings revisions. The stock outperformed the benchmark by a wide margin over the following six months as earnings growth materialized. Another case involved avoiding a seemingly cheap retailer whose negative momentum and downward revisions correctly flagged continued underperformance despite attractive initial valuations.
A third example from the healthcare sector showed how earnings revision strength helped select a company recovering from temporary setbacks, leading to strong subsequent returns. These cases illustrate how the scoring system adds both offensive and defensive value in live decision-making.
Data Sources, Tools, and Implementation Considerations
Reliable data feeds are critical for accurate scoring. Institutional platforms provide clean, timely inputs, while retail investors can combine public filings with analyst estimate databases. Spreadsheet-based implementations work for smaller universes, but dedicated quantitative software improves scalability and reduces manual errors. Always document assumptions and periodically audit data quality to maintain model integrity.
FAQ: Common Implementation Pitfalls for Retail Investors
How often should scores be recalculated? Monthly updates strike a balance between freshness and transaction costs, though some managers prefer weekly refreshes during high-volatility periods.
Should I use free or paid data sources? Free sources introduce lags and inconsistencies; paid providers with daily updates are preferable for active strategies aiming for precision.
What about transaction costs? High turnover erodes alpha. Focus on names with sufficient liquidity and consider rounding scores to reduce unnecessary trades.
Is backtesting enough? Always stress-test across multiple market regimes and include realistic slippage assumptions to avoid over-optimistic projections.
How do I handle missing data? Apply conservative imputation methods or exclude incomplete observations to prevent biased scores.
By following a disciplined quantitative factor scoring process, retail and institutional investors alike can construct active value portfolios better equipped for the opportunities and risks of 2026 markets. CFA Institute resources and Investopedia guides offer additional reading on factor investing best practices, while SEC filings provide primary data for fundamental verification.

No comments yet. Be the first!