 Bullish Portfolio
Introduction to Quantitative Factor Scoring
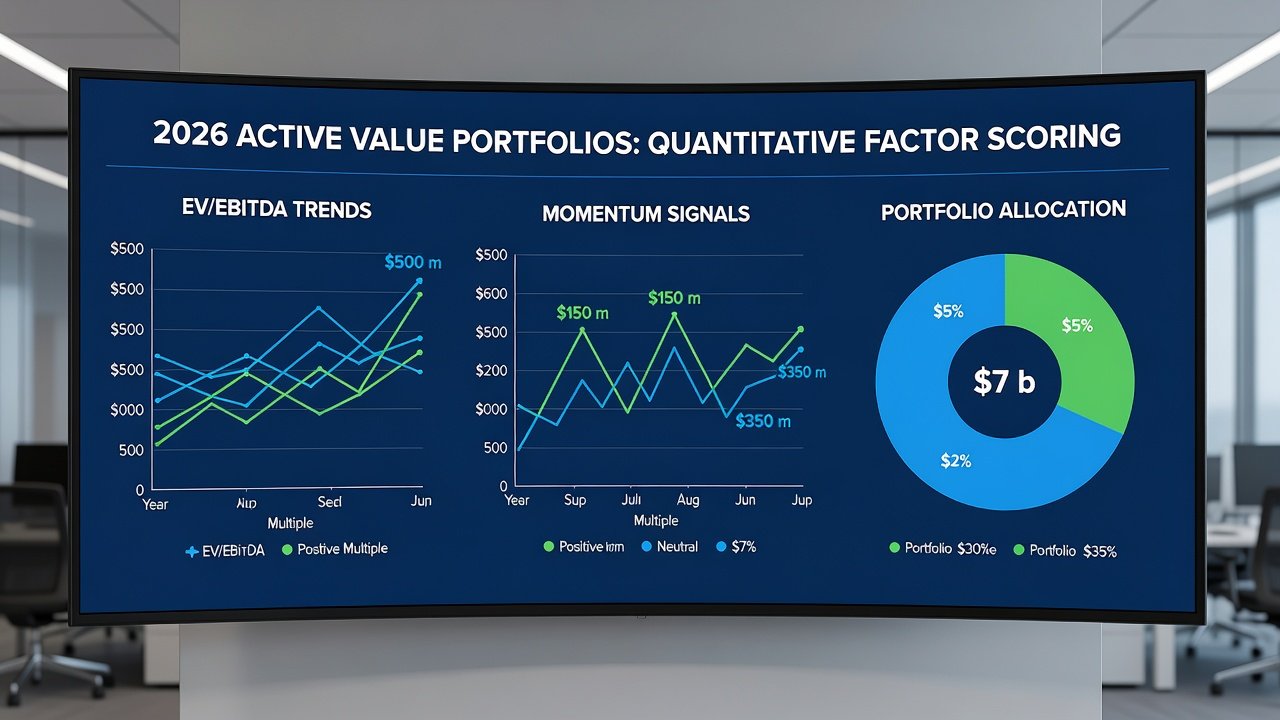
Active value investors in 2026 increasingly rely on quantitative factor scoring to identify undervalued stocks with strong fundamentals and positive momentum. This approach combines traditional value metrics with quality and momentum signals to create robust, data-driven portfolios that adapt to evolving market conditions. Investors who implement these models gain a systematic edge by reducing emotional decision-making and focusing on measurable attributes that historically drive returns.
By developing custom multi-factor models, investors can systematically rank opportunities and allocate capital more effectively than relying on single-metric screens alone. The process begins with selecting relevant factors, gathering clean data, and building a transparent scoring framework that can be backtested and refined over time. In today's environment of rapid information flow and algorithmic trading, such models provide a disciplined way to navigate volatility while targeting attractive risk-adjusted returns.
Core Components of a Multi-Factor Model
A balanced scoring system integrates three primary pillars: value, quality, and momentum. Value metrics highlight undervalued securities by comparing market prices to intrinsic worth. Quality measures assess financial strength and sustainability through profitability, balance sheet health, and operational efficiency. Momentum captures short-term price trends that may persist due to investor behavior and information diffusion.
Successful models assign weights to each factor based on historical performance and current market regime. For 2026 conditions, which include higher interest rate volatility and sector rotation, equal weighting often serves as a starting point before optimization. Investors should periodically review correlations between factors to ensure diversification benefits remain intact. Overlapping signals can dilute the model's effectiveness, so orthogonal factors are preferred when possible.
Step-by-Step Calculation of Key Metrics
Begin with enterprise value to EBITDA (EV/EBITDA). This ratio is calculated as (Market Capitalization + Total Debt - Cash) / EBITDA. Lower values typically indicate attractive valuations relative to earnings power. To implement this in practice, collect the latest balance sheet and income statement figures, then apply the formula consistently across your universe of stocks.
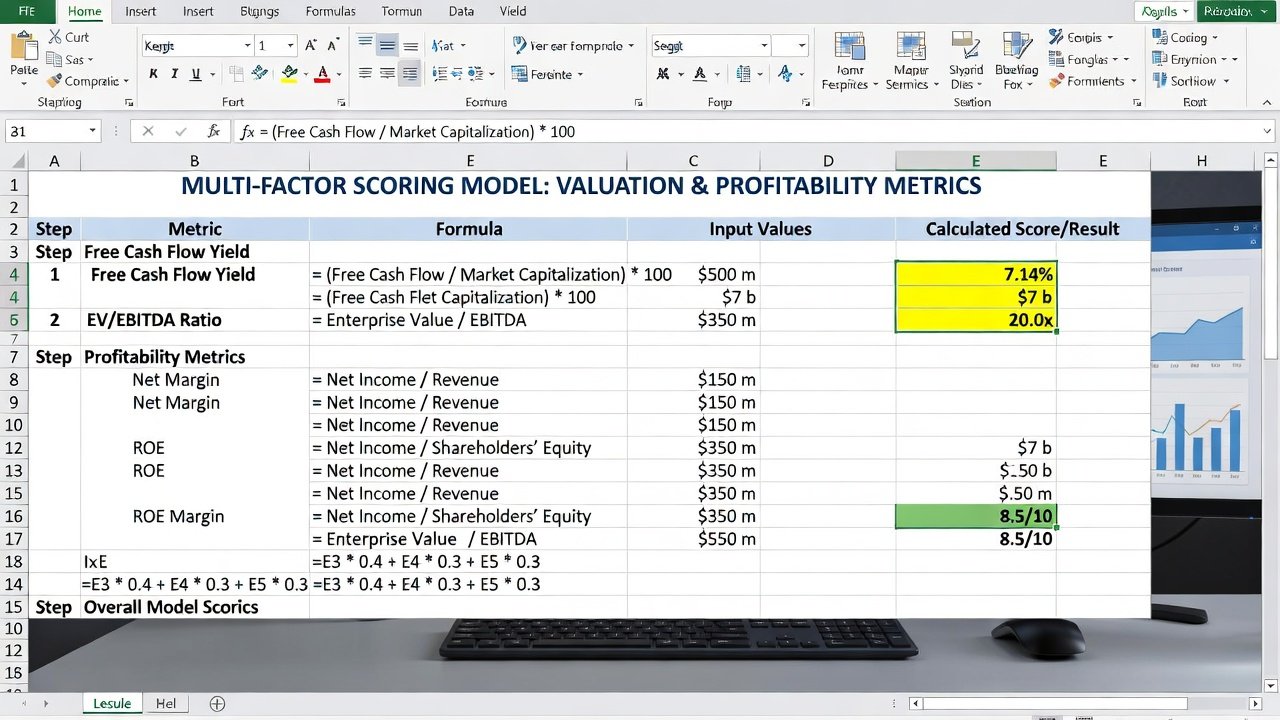
Next, compute free cash flow yield using the formula: Free Cash Flow / Enterprise Value. This metric reveals how much cash a company generates relative to its total value, providing insight into cash generation efficiency. For example, suppose a company reports operating cash flow of $500 million, capital expenditures of $150 million, resulting in $350 million free cash flow. If enterprise value stands at $7 billion, the yield equals 5 percent. Repeat this calculation for each candidate to enable ranking.
Profitability ratios such as return on invested capital (ROIC) and gross margin further refine the quality score. ROIC is calculated as NOPAT / Invested Capital, where NOPAT represents net operating profit after taxes. Gross margin is (Revenue - Cost of Goods Sold) / Revenue. These ratios help filter out companies with weak competitive advantages or unsustainable earnings.
Spreadsheet implementation starts with downloading financial statements from reliable sources. Use columns for each input, then apply formulas in adjacent cells. For example, enter market cap in cell B2, debt in B3, and cash in B4, then calculate EV in B5 with the formula =B2+B3-B4. Extend this across rows for dozens of stocks and add conditional formatting to highlight top deciles. Advanced users can incorporate VBA macros or Python scripts for automation while maintaining audit trails for every calculation step.
Portfolio Weighting Methods
Once scores are generated, apply weighting schemes such as equal weighting, score-based weighting, or optimization techniques like mean-variance. Score-based weighting allocates more capital to higher-ranked securities while maintaining diversification constraints. For instance, normalize scores to sum to 100 percent and adjust position sizes proportionally.
Rebalancing frequency should align with the model's signal decay; quarterly reviews often balance transaction costs against alpha capture in 2026 environments. Investors may also consider minimum position sizes to avoid over-concentration in illiquid names. Comparing historical performance of different weighting schemes through rolling windows helps identify the most robust approach for current conditions.
Backtesting Considerations for 2026 Markets
Backtesting must incorporate realistic assumptions including transaction costs, liquidity filters, and regime shifts. Test across multiple market cycles, with emphasis on 2022-2025 data to simulate current volatility patterns. Include slippage estimates and dividend reinvestment to mirror live trading environments accurately.
Use out-of-sample periods to validate robustness. Avoid overfitting by limiting factor combinations and applying walk-forward optimization. Document every assumption and parameter choice so the process remains reproducible. Sensitivity analysis around key inputs such as lookback periods for momentum reveals how stable results remain under varying conditions.
Risk Controls and Implementation Safeguards
Incorporate position limits, sector caps, and stop-loss rules based on score deterioration. Monitor factor exposures to prevent unintended concentration in any single signal. For example, cap any single stock at 5 percent of portfolio value and limit sector exposure to 25 percent to preserve diversification benefits.
Regular stress testing against scenarios such as rising rates or recession helps maintain portfolio resilience. Track drawdowns in real time and establish rules for reducing exposure when aggregate model scores fall below predefined thresholds. These controls protect capital during unexpected market events while allowing the strategy to participate in favorable regimes.
Manual Versus Automated Scoring Workflows
Manual workflows offer transparency and control, ideal for smaller portfolios or educational purposes. They involve direct spreadsheet updates and manual data verification, allowing investors to understand every input and output intimately. However, they become time-consuming as the universe expands beyond a few hundred securities.
Automated systems leverage APIs for real-time data feeds and script-based calculations, scaling efficiently for larger universes. Hybrid approaches combine both for optimal oversight and speed, with automation handling routine updates while human review validates anomalies. Choose the workflow based on portfolio size, available technology resources, and desired level of customization.
Practical Implementation Steps
- Define your investment universe using liquidity and market-cap filters.
- Collect standardized financial data from primary sources.
- Calculate individual factor scores and normalize them to a common scale.
- Combine scores using predetermined weights and rank securities.
- Apply position sizing rules and construct the portfolio.
- Backtest the full process over historical periods.
- Implement ongoing monitoring and periodic rebalancing.
FAQ on Data Sources
- Where can I source reliable financial data? Start with company filings available at SEC EDGAR for primary source documents.
- What free or low-cost databases support factor calculations? Federal Reserve Economic Data provides macroeconomic context via Federal Reserve resources.
- How frequently should data be refreshed? Daily for momentum, quarterly for fundamentals to match reporting cycles.
- Are there quality checks needed before using data? Always verify consistency across multiple periods and cross-check outlier values against alternative sources.
- What tools help automate data collection? Consider open-source libraries that interface directly with public financial databases for repeatable pipelines.
Conclusion
Implementing a quantitative factor scoring system empowers investors to construct disciplined value portfolios. By mastering metric calculations, weighting strategies, and risk management, practitioners can enhance returns while controlling downside in 2026 market conditions. Consistent application and ongoing refinement turn these models into powerful tools for long-term outperformance.

No comments yet. Be the first!