 Bullish Portfolio
Introduction to Stock Screeners in 2026 Markets
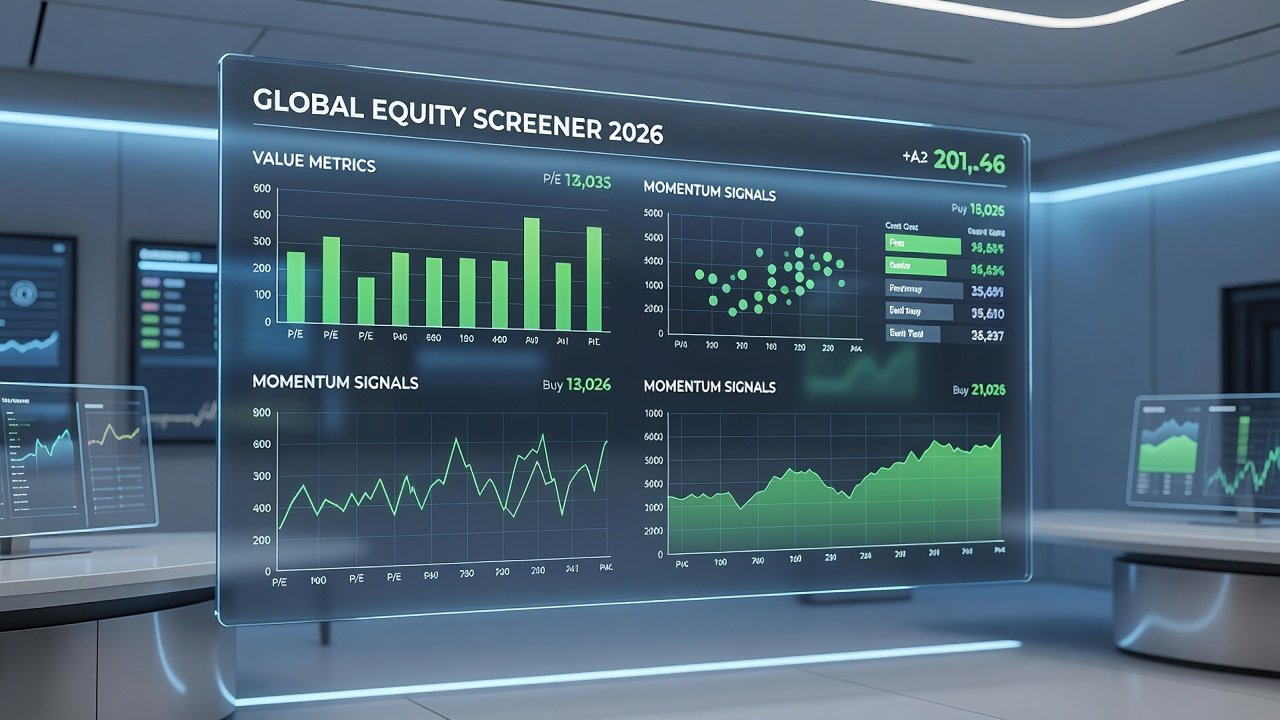
Stock screeners have become essential tools for investors seeking to combine traditional value metrics with active momentum signals. In today's dynamic markets, these platforms help filter thousands of equities based on customizable criteria, enabling more informed decisions. This showdown examines leading free and paid options, focusing on features like custom factor filters, real-time alerts, and seamless integration with valuation models. Investors in 2026 face volatile conditions driven by shifting interest rates and sector rotations, making precise screening more critical than ever before.
Whether you're managing a small portfolio or scaling up, understanding the strengths of each screener can streamline your workflow. We'll explore three hands-on screening examples tailored for 2026 conditions, along with setup steps, mobile considerations, and export capabilities for dynamic watchlists. By the end of this guide, you will have actionable insights to select and optimize the right tool for your strategy.
Key Comparison Criteria for Stock Screeners
When evaluating screeners, focus on core capabilities that support active value strategies. Custom factor filters allow users to blend metrics such as price-to-earnings ratios with momentum indicators like relative strength. Real-time alerts notify traders of changes in key data points, while integration with valuation models enables deeper analysis directly within the platform. Additional considerations include data accuracy, historical backtesting depth, and compatibility with third-party analytics software.
Leading options include free tools like Finviz and TradingView's basic tier alongside paid platforms from providers such as Bloomberg Terminal alternatives and advanced services. Free screeners excel in accessibility but often limit advanced alerts or data exports. Paid versions typically offer superior customization and performance tracking, though the trade-offs depend on individual needs. For regulatory context on market data standards, consult resources from the U.S. Securities and Exchange Commission.
Additional factors include mobile access for on-the-go screening and export options that feed into spreadsheets or portfolio software. Performance tracking features, such as backtesting results and historical data overlays, further differentiate the tools. Users should also assess API availability for automated workflows and the breadth of global market coverage.
Head-to-Head: Free vs. Paid Screeners
Free screeners provide solid entry points for beginners, supporting basic value filters and simple momentum signals. However, they may lack robust real-time notifications or direct model integrations. Paid screeners deliver enhanced precision, including API connections for valuation software and comprehensive alert systems. The decision often hinges on trading volume and the need for professional-grade data feeds.
Cost-benefit analysis reveals that free tools suit occasional users, while paid options justify investment for frequent traders through time savings and advanced insights. Both categories support watchlist creation, but paid platforms often include collaborative features and automated rebalancing suggestions. Consider these trade-offs when scaling your approach:
- Free screeners: Strong for initial discovery but limited in alert frequency and export volume.
- Paid screeners: Superior for multi-factor combinations and real-time portfolio syncing.
- Hybrid users: Start free and upgrade as strategies grow more complex.
Market data reliability remains a shared strength across reputable platforms, with many drawing from official sources like the Federal Reserve for economic indicators.
Practical Screening Example 1: Value with Momentum Crossover
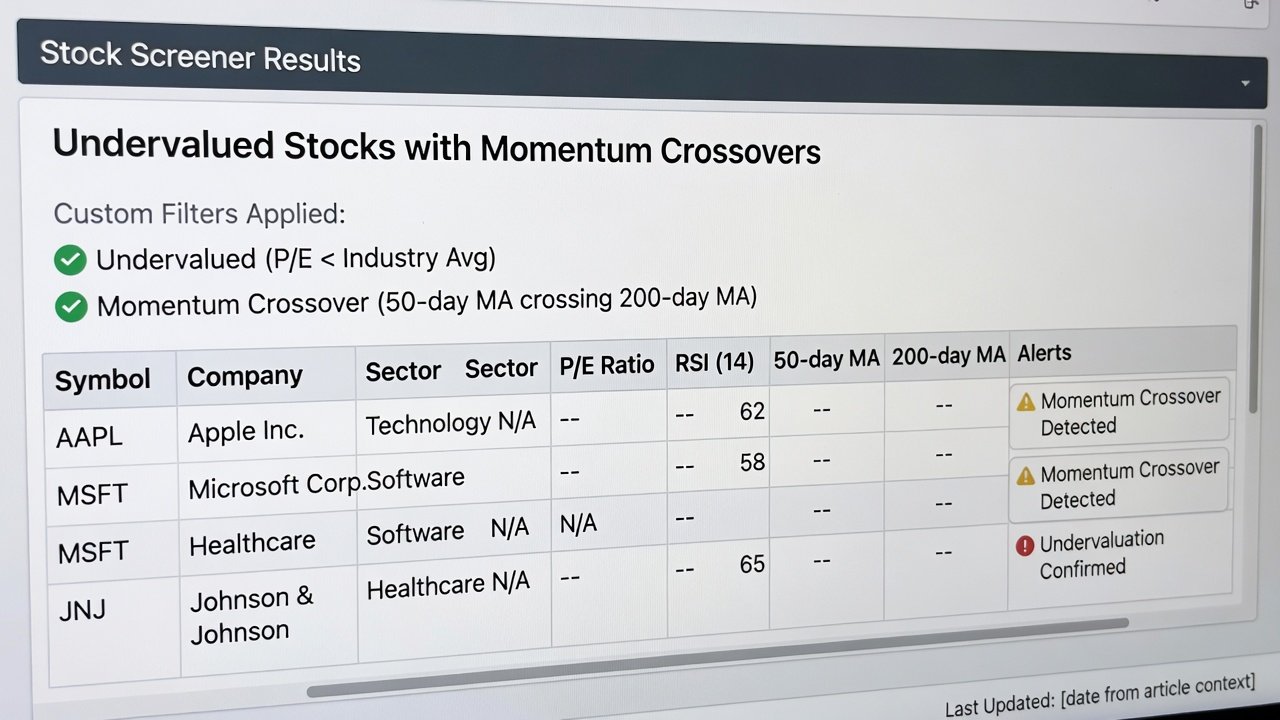
Start by setting filters for low price-to-book ratios under 1.5 combined with 50-day moving average crossovers above the 200-day line. Add volume surge criteria exceeding 150% of the average. This identifies undervalued stocks showing renewed interest in 2026 markets. Export the results to CSV for further analysis in your preferred spreadsheet tool. Refine the screen by adding sector neutrality rules to avoid over-concentration in any single industry. Review the output daily and adjust thresholds based on recent volatility patterns observed in broad market indices.
Practical Screening Example 2: Dividend Value with Relative Strength
Apply criteria including dividend yields above 3%, payout ratios below 60%, and 12-month relative strength rankings in the top quartile. Layer in earnings growth filters for sustainability. This approach targets stable value plays with active momentum confirmation. Mobile apps from most platforms allow quick adjustments while traveling. Test the screen across multiple timeframes to ensure consistency, then save it as a reusable template for weekly reviews. Incorporate qualitative checks such as recent news sentiment to complement the quantitative signals.
Practical Screening Example 3: Multi-Factor Value-Momentum Blend
Combine enterprise value to EBITDA under 8 with MACD histogram positive readings and institutional ownership increases. Include sector exclusions for diversification. Run the screen weekly and set alerts for threshold breaches. Integration with external valuation models, such as discounted cash flow templates, enhances decision-making. Track the screened list over several market cycles to validate performance and refine parameters for future iterations.
Setup Steps, Mobile Access, and Export Options
Begin by creating an account and navigating to the screener dashboard. Input your custom factors one by one, testing incrementally. Most platforms offer preset templates for value-momentum strategies that you can modify. For mobile, download the dedicated apps to access full functionality on iOS or Android devices, though some advanced filters may require desktop versions. Sync your watchlists across devices to maintain continuity during travel or remote work sessions.
Export options typically include CSV, Excel, and direct sync to portfolio trackers. Dynamic watchlists update automatically based on saved criteria, supporting ongoing monitoring without manual refreshes. Advanced users can leverage API endpoints to push results into custom dashboards or risk management systems. Always verify data freshness before executing trades based on exported lists.
Cost-Benefit Trade-Offs and Performance Tracking
Evaluate platforms based on how well their features align with your trading frequency. Free options minimize expenses but may require workarounds for alerts. Paid tiers provide ROI through reduced research time and better signal accuracy. Performance tracking often includes customizable dashboards showing win rates and drawdowns for screened ideas. Review historical performance within each tool to validate strategy effectiveness before live deployment. Many platforms now incorporate machine learning overlays to highlight potential outliers in your results.
Common Mistakes to Avoid When Using Stock Screeners
One frequent error is over-optimizing filters without considering real-world liquidity constraints. Another is neglecting to rebalance watchlists after major market events. Always cross-reference outputs with fundamental research rather than relying solely on automated signals. Finally, avoid ignoring transaction costs when backtesting strategies derived from screen results.
Conclusion
Selecting the right stock screener depends on balancing functionality with budget. By mastering custom filters and alerts, investors can effectively merge value principles with active signals for 2026 opportunities. Test multiple platforms using the examples above to find your ideal match and continuously monitor evolving market conditions.
FAQ: Matching Screeners to Portfolio Sizes and Experience Levels
- Beginners with small portfolios: Opt for free screeners with intuitive interfaces and basic mobile support. Focus first on learning core value and momentum combinations before adding complexity.
- Intermediate users managing mid-sized accounts: Choose paid tools offering alerts and export features for efficient tracking. Integrate these with simple valuation spreadsheets to enhance analysis depth.
- Advanced traders with large portfolios: Prioritize platforms with deep model integrations and robust performance analytics. Leverage API features for automated reporting and team collaboration.
Always start with paper trading to refine your approach before committing capital. Revisit your chosen screener settings quarterly to adapt to new market regimes.

No comments yet. Be the first!