 Bullish Portfolio
Introduction to Quantitative Factor Scoring in Value Investing
In 2026, active value investors are increasingly turning to quantitative factor scoring to identify undervalued stocks with strong fundamentals. This approach combines traditional value metrics with active management tactics and momentum overlays to construct resilient portfolios. By blending data-driven signals, investors can systematically screen opportunities while mitigating emotional biases that often plague discretionary stock picking. The methodology allows for objective ranking across thousands of securities, making it scalable for both individual and institutional portfolios.
The core idea is to assign scores to stocks based on multiple factors and rank them for portfolio inclusion. This method has gained traction amid volatile markets, allowing for dynamic adjustments rather than static buy-and-hold strategies. Investors benefit from transparency in decision-making and the ability to backtest assumptions rigorously before live deployment.
Key Metrics for Factor Scoring Models
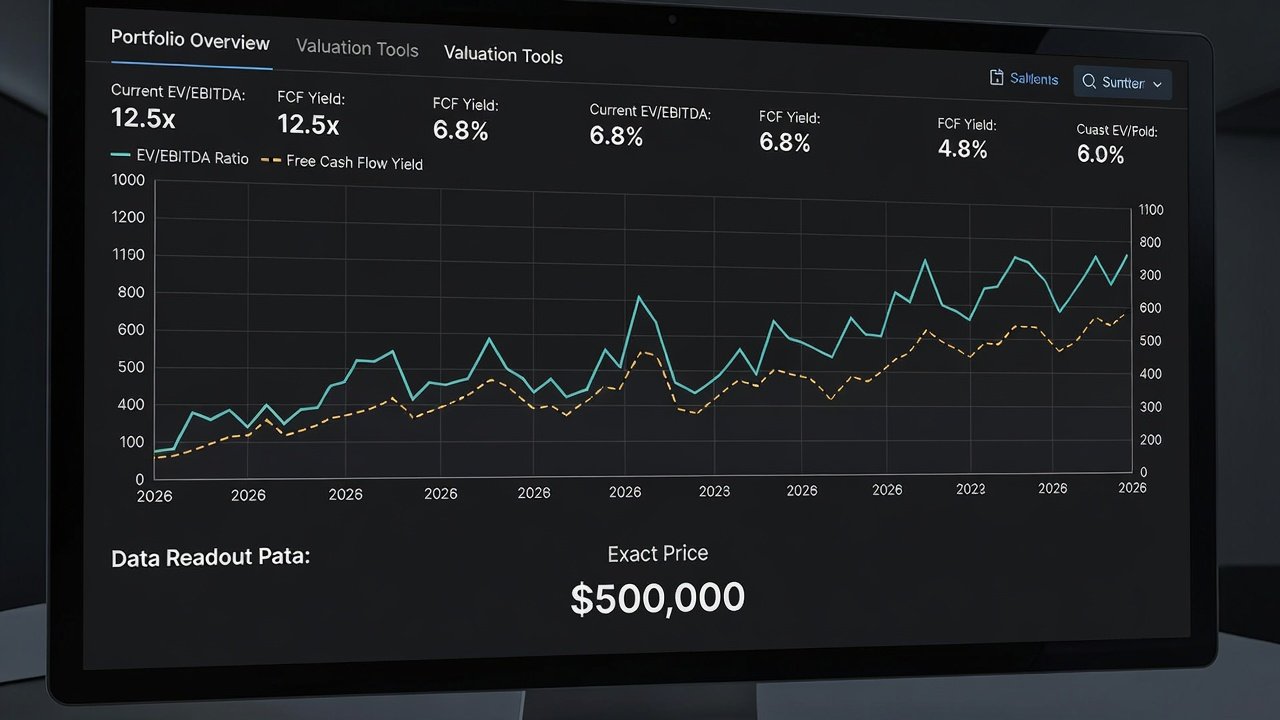
Effective models start with proven value indicators. EV/EBITDA remains central for assessing enterprise value relative to earnings before interest, taxes, depreciation, and amortization, helping highlight companies trading at discounts to their operational earnings power. Free cash flow yields help gauge cash generation efficiency, revealing firms that convert profits into actual cash available for shareholders or reinvestment.
Quality profitability ratios such as return on invested capital (ROIC) and gross margins filter for sustainable businesses that maintain competitive advantages over time. Momentum overlays add a layer of active insight by incorporating 12-month price trends or relative strength indicators to capture short-term market sentiment without abandoning the value core. Together, these create a multi-factor framework that balances cheapness with quality and timeliness, reducing the risk of value traps where cheap stocks remain cheap due to deteriorating fundamentals.
Step-by-Step Construction of a Custom Scoring Model
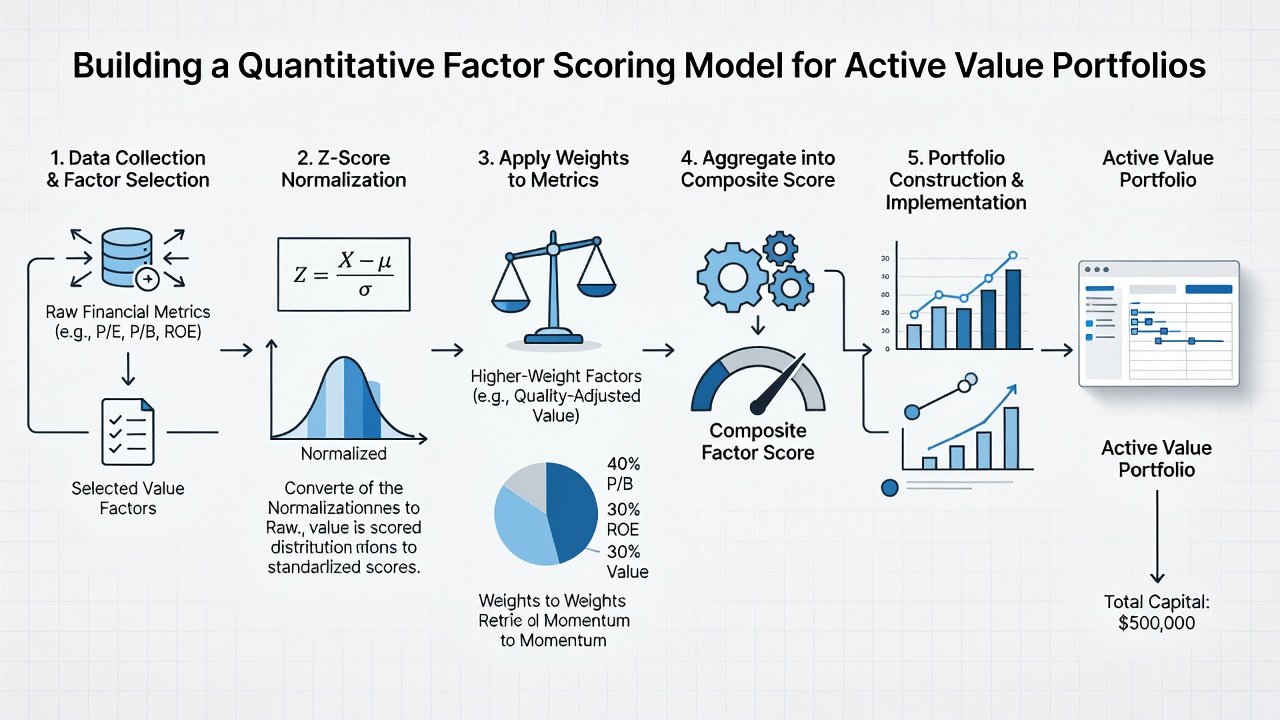
Building your model begins with data collection from reliable financial databases. Normalize each metric across the universe of stocks, then apply weights based on historical performance. For example, assign 30% to EV/EBITDA, 25% to free cash flow yield, 25% to quality ratios, and 20% to momentum. This weighting can be adjusted based on regime-specific backtests, such as favoring quality more during economic uncertainty.
- Define the investment universe, typically excluding micro-caps for liquidity reasons and focusing on sectors aligned with value characteristics.
- Screen for stocks with positive free cash flow to eliminate those burning cash.
- Calculate z-scores for each factor to standardize values across different scales and distributions.
- Combine into a composite score and rank from highest to lowest, creating a clear hierarchy for selection.
- Apply liquidity filters and minimum market cap thresholds to ensure tradability in live portfolios.
- Incorporate sector adjustments to prevent overexposure to any single industry group.
Practical examples include running the model on a 5,000-stock universe and selecting the top decile for further analysis. This process can be automated in spreadsheets or coding environments for repeatability.
Portfolio Backtesting and Risk Adjustments
Backtesting validates the model using historical data up to late 2026. Use rolling windows to simulate real-time decisions and incorporate realistic assumptions around turnover and slippage. Risk adjustments include volatility scaling, where position sizes are reduced for high-beta names, and sector neutrality to avoid concentration in cyclical industries that may appear cheap but carry hidden risks.
Compare results against benchmarks like the S&P 500 value index. Focus on metrics such as Sharpe ratio, maximum drawdown, and information ratio for a complete picture. Stress testing against scenarios like rising interest rates or recessionary periods adds robustness. Investors should also evaluate turnover rates to ensure the strategy remains practical after costs.
Real-World Stock Screening Walkthrough
Consider a sample screen on mid-cap value names across multiple sectors. Apply the weighted factors to generate a top-20 list, then review qualitative factors like management quality or upcoming catalysts. Rebalance quarterly while monitoring for data lags, which can distort scores if earnings releases are delayed. In one walkthrough, the model might highlight companies with strong free cash flow yields combined with improving momentum, leading to a diversified basket of 15-25 holdings.
Common Pitfalls and How to Avoid Them
- Overfitting: Limit parameters and use out-of-sample testing on unseen data periods to prevent curve-fitting to historical noise.
- Data lag: Source from providers with real-time updates and build in conservative lag assumptions for reported financials.
- Survivorship bias: Include delisted stocks in backtests to reflect the true opportunity set available at any point in time.
- Look-ahead bias: Ensure all data used would have been available on the rebalance date.
Actionable Templates for Immediate Implementation
Downloadable spreadsheet templates can automate scoring with Excel formulas or Python scripts using libraries for data analysis. Integrate with existing platforms for seamless execution and alerts. Start small with paper trading before committing capital, and document every assumption for future refinement. These templates typically include input cells for custom weights and output dashboards for score visualization.
Scaling Models for Different Portfolio Sizes and Tool Integration
For smaller portfolios under $500,000, focus on fewer holdings with broader diversification across factors to manage transaction costs. Larger portfolios can incorporate more granular screens and derivatives overlays for risk management. Integration with tools like Bloomberg terminals or open-source platforms allows real-time data feeds and automated rebalancing signals. FAQs often address whether these models work for retirement accounts or how frequently to update weights based on market regime shifts.
Conclusion
Quantitative factor scoring empowers active value investors to navigate 2026 markets with precision. By mastering these techniques and avoiding key pitfalls, portfolios can achieve superior risk-adjusted returns over time. For further reference, explore resources on the SEC website, FRED economic data, and Federal Reserve site.

No comments yet. Be the first!