 Bullish Portfolio

Introduction to Multi-Factor Models in Active Value Investing
Active value investors in 2026 operate in a landscape defined by persistent inflation pressures, technological disruption, and geopolitical uncertainties that influence equity valuations across sectors. Traditional single-factor value approaches often fall short when markets favor growth or when economic cycles shift rapidly. Multi-factor models provide a robust framework by integrating complementary signals that enhance both return potential and downside protection. These models allow investors to systematically blend active stock selection with enduring value principles, creating portfolios that adapt to changing conditions while maintaining a focus on undervalued opportunities. This comprehensive guide details the construction process, including factor selection, weighting methodologies, rebalancing protocols, and real-world applications tailored to 2026 market dynamics.
Key Factors in Multi-Factor Value Portfolios
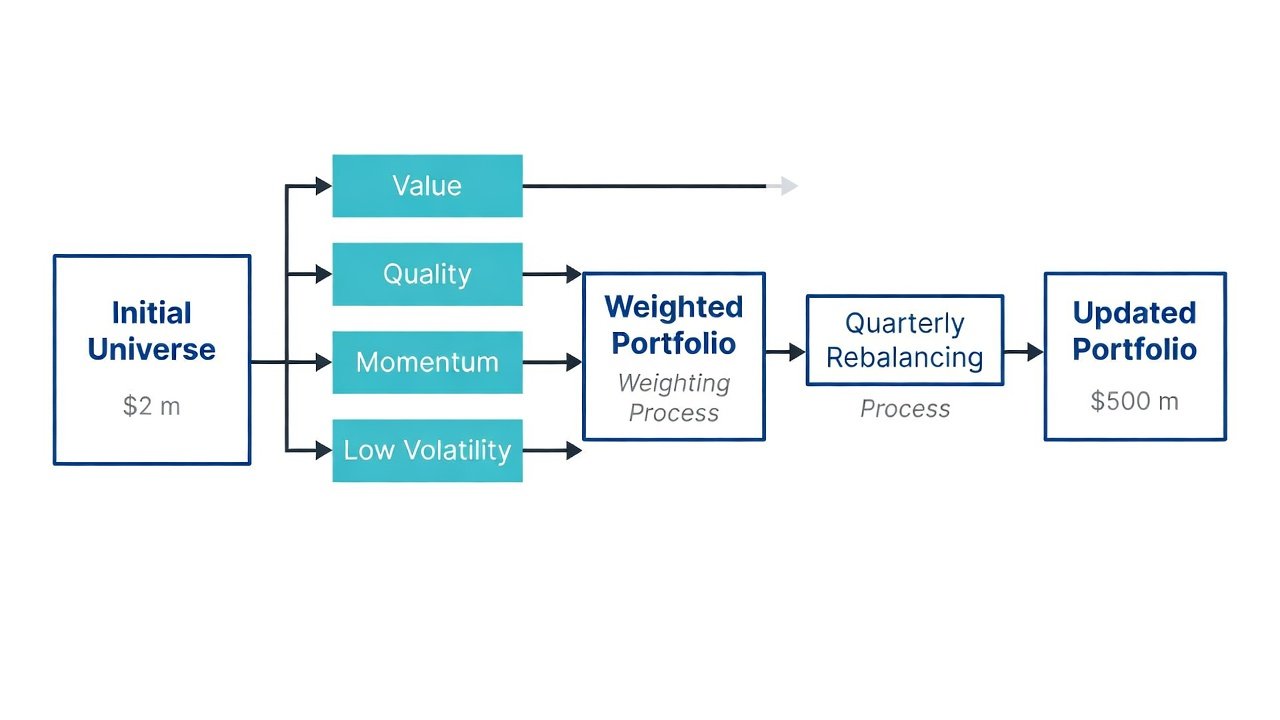
The foundation of effective multi-factor models rests on four interconnected factors: value, quality, momentum, and low volatility. Value focuses on identifying securities trading below their intrinsic worth through ratios such as price-to-earnings, price-to-book, and enterprise value to EBITDA. In practice, an investor might screen for companies where these metrics fall in the lowest quartile relative to sector peers, signaling potential mean reversion. Quality adds a layer of fundamental strength by prioritizing firms with high return on invested capital, stable earnings growth over five years, and low debt-to-equity ratios, which help avoid value traps where cheap stocks remain cheap due to deteriorating business models. Momentum captures short- to medium-term price trends, typically measured over six to twelve months, allowing the model to ride positive sentiment while value anchors the selection. Low volatility screens for stocks with beta below one and historical standard deviation in the bottom quartile, reducing portfolio drawdowns during turbulent periods like those anticipated in 2026 amid policy shifts. These factors interact synergistically because pure value exposure can lag in momentum-driven rallies, yet quality and low volatility provide ballast that improves overall Sharpe ratios in backtests spanning multiple market regimes.
Practical Steps for Weighting and Rebalancing in 2026 Conditions
Constructing weights begins with a quantitative scoring system where each stock receives normalized scores across the four factors. A sample allocation might start with 35 percent value, 30 percent quality, 20 percent momentum, and 15 percent low volatility, adjusted based on current economic signals such as yield curve steepness or corporate earnings revisions. Optimization software can then minimize tracking error relative to a custom benchmark while enforcing constraints like maximum sector exposure of 25 percent. Rebalancing occurs on a quarterly cadence or when any factor drift exceeds 5 percentage points, incorporating transaction cost estimates to avoid overtrading. In 2026 specifically, investors should layer in forward-looking adjustments by monitoring Federal Reserve communications and global supply chain data, which influence volatility and momentum signals. Step-by-step workflow includes: 1) Define the investable universe of liquid equities above a minimum market capitalization threshold. 2) Calculate factor z-scores using trailing twelve-month data. 3) Apply composite scoring and rank securities. 4) Optimize weights subject to liquidity and diversification rules. 5) Execute trades and document deviations for audit purposes.
Portfolio Construction Examples and Screening Workflows
A practical example starts with a 100-stock universe drawn from developed markets. Apply sequential screens: retain only those with price-to-book below the median for value, return on equity above 12 percent for quality, 12-month price appreciation in the top third for momentum, and 36-month volatility below the 40th percentile for low volatility. The resulting 25 holdings receive equal initial weights within factor buckets before final optimization blends them. Screening workflows leverage API-connected databases to pull financial statements and price histories daily, feeding into Python or R scripts that automate z-score calculations and flag outliers. This process ensures transparency and repeatability, with documentation of every exclusion reason to support compliance reviews.
Risk-Adjusted Performance Comparisons
Evaluating multi-factor models against pure value benchmarks reveals consistent advantages in risk metrics. For instance, blended approaches historically exhibit 15 to 25 percent lower maximum drawdowns while maintaining comparable or higher annualized returns over rolling five-year windows. Sharpe ratios improve from approximately 0.6 in single-factor value to 0.85 or above when momentum and low volatility overlays are added, reflecting better capture of upside trends without excessive exposure to speculative names. Investors should run scenario analyses covering rising-rate environments and recessionary shocks to confirm robustness before live deployment.
Case Studies for Different Investor Profiles
Consider a conservative retiree profile managing a $2 million portfolio: the model tilts heavily toward quality and low volatility (50 percent combined) to prioritize income stability and capital preservation, resulting in smoother equity curves during market corrections. In contrast, a mid-career professional with high risk tolerance allocates 30 percent to momentum within the value framework, enabling participation in sector rotations such as technology or industrials while still anchoring to discounted valuations. An institutional endowment case study demonstrates scaling the same model across $500 million in assets by incorporating liquidity buffers and ESG exclusions, achieving superior risk-adjusted performance versus passive value indexes over a three-year horizon. Each profile underscores the importance of customizing factor weights to match time horizon, liquidity needs, and behavioral tolerance for volatility.
Common Mistakes to Avoid and Data Sources for 2026
Implementation errors often stem from overfitting historical factor premiums without forward validation or neglecting liquidity costs in smaller-cap names. Another frequent pitfall involves static weighting that ignores regime changes, leading to unintended style drift. Reliable data sources include regulatory filings for fundamental metrics and exchange-provided price series, supplemented by research from the CFA Institute. Additional macroeconomic context comes from the IMF and Federal Reserve publications, while the SEC EDGAR system supplies timely corporate disclosures essential for accurate screening.
FAQs on Implementation Pitfalls and Data Sources
- What data frequency works best? Daily prices paired with quarterly fundamental updates balance timeliness and noise reduction.
- How to handle missing data points? Use sector medians or peer averages to impute values conservatively.
- Are transaction costs material? Yes, especially for momentum components; model them explicitly at 10 to 20 basis points per round-trip.
- Can retail investors replicate these models? Yes, using publicly available screeners and spreadsheet optimizers, though professional platforms accelerate the process.
- What regulatory considerations apply in 2026? Ensure compliance with fiduciary standards by documenting all model assumptions and backtest methodologies.
Conclusion
Multi-factor models represent a powerful evolution for active value portfolios in 2026 by systematically combining complementary signals that improve both returns and risk management. Through deliberate factor integration, disciplined rebalancing, and profile-specific customization, investors can construct resilient allocations that withstand market variability while capturing undervalued opportunities. Continuous monitoring against authoritative data sources and avoidance of common implementation traps further enhance long-term success.

No comments yet. Be the first!