 Bullish Portfolio

Introduction to Ratio Analysis in Active Value Investing
Ratio analysis remains a cornerstone for intermediate investors seeking to identify undervalued stocks with strong fundamentals. In 2026, blending active stock selection with value principles requires adapting traditional metrics to evolving market conditions such as higher interest rates, inflationary pressures, and sector-specific disruptions from technological advancements. This deep dive covers key ratios across profitability, liquidity, and leverage categories, complete with step-by-step calculations, real-world examples, and adjustments tailored for the current environment. Unlike basic DCF models that rely heavily on future projections and assumptions, ratio analysis provides immediate, data-driven insights directly from financial statements like the balance sheet, income statement, and cash flow statement. Investors can screen thousands of stocks efficiently by focusing on these metrics to uncover opportunities in value plays while actively managing positions based on emerging trends.
By mastering these tools, investors move beyond surface-level valuation to understand operational efficiency, financial health, and risk exposure. This approach proves especially valuable when markets exhibit volatility, allowing for timely adjustments that protect capital and enhance returns over the long term.
Profitability Ratios: Gauging Earnings Efficiency
Profitability ratios reveal how effectively a company converts revenue into profit and manages its resources. Key metrics include return on equity (ROE), return on assets (ROA), net profit margin, and operating margin. These indicators help distinguish truly undervalued companies from those with temporary setbacks.
Calculating Return on Equity (ROE) and Return on Assets (ROA)
ROE = Net Income / Shareholders' Equity. For example, if a company reports $500 million in net income and $2 billion in equity, ROE equals 25%. ROA = Net Income / Total Assets, providing insight into asset utilization. In 2026, adjust for one-time items like restructuring costs or impairment charges to avoid distortions from economic shifts and supply chain realignments. Step-by-step: First extract net income from the income statement, then locate equity or assets from the balance sheet, and finally divide while cross-referencing with prior periods for trend analysis.
Net Profit Margin and Operating Margin
Net Profit Margin = (Net Income / Revenue) x 100. Operating Margin focuses on core operations: Operating Income / Revenue. These help compare peers within industries where margins vary widely due to competitive dynamics. Real-world screening example: Filter stocks with ROE above 15%, ROA exceeding 8%, and consistent margins over five years to target value candidates in consumer staples and industrials sectors. This process often highlights firms with durable competitive advantages that active managers can accumulate during market dips.
Liquidity Ratios: Assessing Short-Term Resilience
Liquidity metrics ensure companies can meet near-term obligations without disrupting operations or selling assets at unfavorable prices. In an active value strategy, strong liquidity signals the ability to weather downturns and capitalize on opportunities.
Current Ratio and Quick Ratio Calculations
Current Ratio = Current Assets / Current Liabilities. Quick Ratio excludes inventory: (Current Assets - Inventory) / Current Liabilities. Aim for current ratios above 1.5 in volatile 2026 markets where interest expenses may rise. Step-by-step calculation involves pulling current assets and liabilities from the balance sheet, subtracting inventory for the quick ratio, and comparing against industry norms. Additional metrics like the cash ratio provide even stricter tests of immediate solvency.
Portfolio impact case study: A manufacturing firm with a quick ratio of 1.2 avoided cash crunches during supply chain issues, preserving value for long-term holders by maintaining dividend payments and avoiding dilutive equity raises.
Leverage Ratios: Managing Debt Exposure
Leverage ratios highlight financial risk from debt financing, which becomes critical when central banks maintain elevated policy rates. Understanding these helps active investors avoid value traps burdened by unsustainable obligations.
Debt-to-Equity and Interest Coverage
Debt-to-Equity = Total Liabilities / Shareholders' Equity. Interest Coverage = EBIT / Interest Expense. Ratios above 2.0 for coverage indicate safer positions amid rising rates in 2026. Step-by-step: Gather total debt and equity figures, compute the ratio, then calculate coverage using earnings before interest and taxes divided by annual interest payments. Monitor changes over quarters to detect rising leverage early.
Learn more about financial ratios from Investopedia. Access company filings via the SEC website.
2026 Market Adjustments to Traditional Ratios
Inflation and tech advancements require tweaks, such as incorporating adjusted EBITDA for non-cash items or sector-specific benchmarks for EV/EBITDA multiples. Investors should also factor in environmental, social, and governance adjustments that increasingly influence valuations. For instance, companies in energy may show temporarily depressed ratios due to transition costs, yet offer long-term value if leverage remains controlled. Forward-looking adjustments include normalizing earnings for pandemic-era anomalies and incorporating interest rate sensitivity analysis into coverage ratios.
Real-World Screening Examples and Portfolio Impact Case Studies
Consider screening the Russell 1000 for stocks with ROE greater than 18%, debt-to-equity below 0.6, and positive free cash flow yield. One case involved a healthcare provider that met these criteria, leading to a 22% outperformance versus the broader index over 12 months after acquisition at a discounted price-to-book ratio. Another example in the industrial sector showed how liquidity improvements post-restructuring turned a potential value trap into a core holding. These cases illustrate the power of combining multiple ratios rather than relying on any single metric in isolation.
Comparison Tables Across Sectors
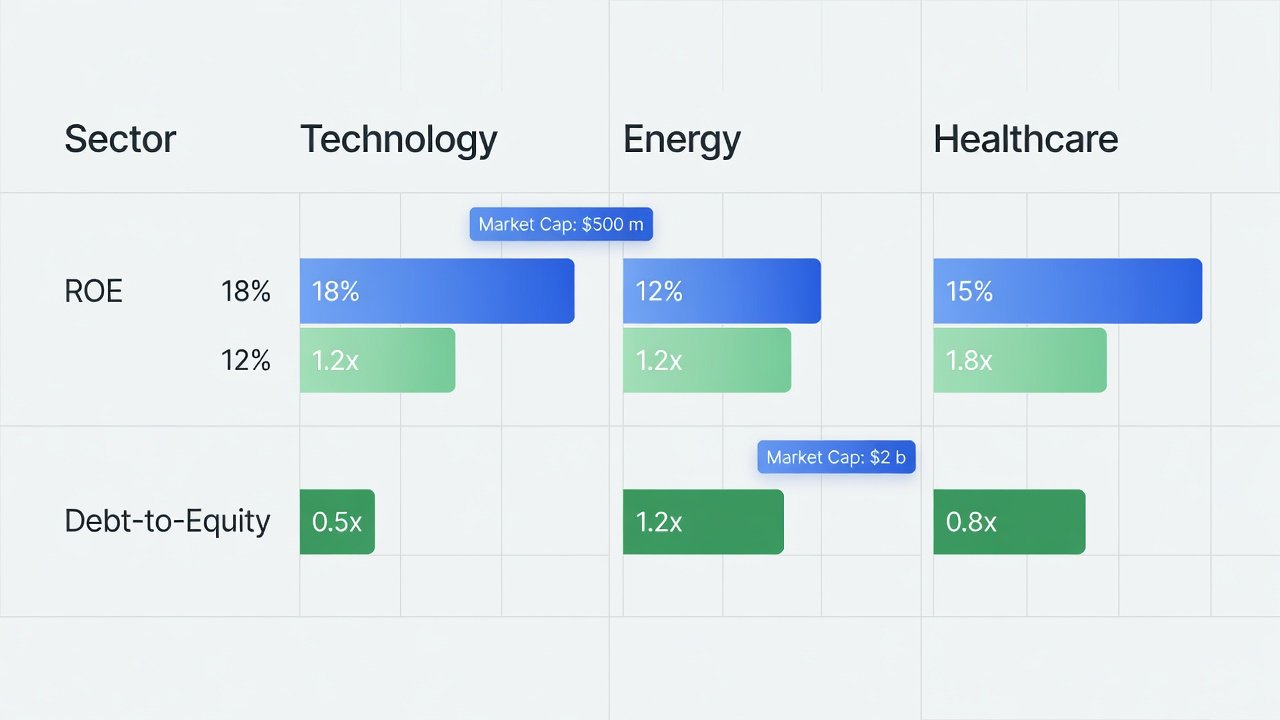
| Sector | Avg ROE | Avg Current Ratio | Avg Debt-to-Equity | Avg Interest Coverage |
|---|---|---|---|---|
| Technology | 22% | 1.8 | 0.4 | 15.2 |
| Energy | 14% | 1.3 | 0.7 | 8.5 |
| Healthcare | 18% | 2.1 | 0.5 | 12.3 |
| Consumer Staples | 16% | 1.6 | 0.6 | 10.8 |
Common Pitfalls to Avoid
- Overlooking off-balance-sheet items such as operating leases or contingent liabilities that can inflate leverage ratios unexpectedly
- Ignoring industry context in comparisons, as a 20% ROE may be exceptional in utilities but average in software
- Using outdated data without forward adjustments for macroeconomic changes like 2026 rate environments
- Chasing high ratios without sustainability checks, leading to investments in firms with declining competitive positions
- Failing to reconcile GAAP and non-GAAP figures, which can distort margin analysis
Practical Implementation Checklist
- Download latest 10-K and 10-Q filings from SEC EDGAR for target companies
- Calculate core ratios using consistent formulas across multiple periods
- Compare against sector medians and historical averages for context
- Stress-test for 2026 scenarios like rate hikes or commodity price swings
- Integrate into portfolio allocation with position sizing rules and stop-loss thresholds
- Monitor quarterly updates and rebalance when ratios breach predefined bands
- Cross-reference with qualitative factors such as management commentary and competitive moats
Review economic data from the Federal Reserve. Explore market data and listings on the NYSE site.
Conclusion
Mastering these ratios empowers investors to make informed active value decisions in 2026. Combine them with ongoing monitoring and disciplined execution for superior portfolio outcomes that withstand market fluctuations.


No comments yet. Be the first!