 Bullish Portfolio

Introduction to Tracking Active Value Investing Performance
Active value investing merges disciplined stock selection with a focus on undervalued companies that offer strong fundamentals. In 2026, market volatility driven by shifting interest rates, geopolitical events, and sector rotations makes precise performance tracking essential. Investors must blend traditional value ratios with sophisticated risk-adjusted measures to separate genuine skill from market noise. This comprehensive guide examines alpha, information ratio, downside capture ratio, price-to-earnings multiples, and free cash flow yield in detail, offering calculations, real-world interpretations, and portfolio application examples.
By establishing a repeatable measurement framework, investors can detect strategy drift early, compare results against appropriate benchmarks, and implement timely adjustments that support long-term outperformance. The sections below include step-by-step examples, quarterly review processes, and automation recommendations tailored to 2026 market conditions.
Alpha: Quantifying Excess Returns After Risk Adjustment
Alpha measures the portion of portfolio return not explained by exposure to market movements. Positive alpha indicates that active decisions added value beyond what a passive benchmark would have delivered. The standard calculation uses the Capital Asset Pricing Model: Alpha = Portfolio Return − [Risk-Free Rate + Beta × (Benchmark Return − Risk-Free Rate)].
Consider a hypothetical 2026 example using twelve-month data ending mid-year. A concentrated value portfolio delivered 13.8% while the Russell 1000 Value Index returned 10.9%. With the risk-free rate at 4.3% and portfolio beta of 1.05, alpha equals 13.8 − (4.3 + 1.05 × 6.6) = 2.57%. This result shows meaningful outperformance after adjusting for systematic risk. Investors should recalculate alpha monthly and examine rolling twelve-month periods to smooth short-term volatility.
Information Ratio: Evaluating Consistency of Excess Returns
The information ratio assesses how much excess return is generated for each unit of active risk taken. It is computed as (Portfolio Return − Benchmark Return) ÷ Tracking Error. A ratio above 0.5 typically signals skilled active management rather than random variation. Tracking error itself is the standard deviation of active returns, highlighting how much the portfolio deviates from its benchmark.
In practice, a value investor might maintain an information ratio of 0.72 over three years by concentrating on high-conviction holdings with improving free cash flow. When the ratio drops below 0.3, it often signals that recent additions are not contributing enough incremental return relative to the extra volatility introduced.
Downside Capture Ratio: Assessing Capital Preservation
Downside capture quantifies portfolio behavior during market declines. The ratio is derived by dividing the portfolio’s average return in down-market quarters by the benchmark’s average return in the same periods. Ratios below 100% indicate superior downside protection, a critical attribute for value strategies that emphasize margin of safety.
For instance, during the three down quarters recorded in late 2025 and early 2026, a sample portfolio fell an average of 6.2% while the benchmark declined 8.1%. The resulting downside capture of 76.5% demonstrates effective stock selection that limited losses. Monitoring this metric helps investors avoid holdings that amplify losses in bearish environments.
Traditional Value Metrics: P/E Ratios and Free Cash Flow Yield
Price-to-earnings ratios remain foundational for identifying undervalued securities. Forward P/E, based on expected earnings, is particularly useful in 2026 when earnings growth varies widely across sectors. Complementing P/E, free cash flow yield measures cash available to shareholders relative to price and is calculated as Free Cash Flow per Share ÷ Current Price.
A portfolio holding trading at a forward P/E of 11.4 with a free cash flow yield of 7.8% offers both earnings support and cash generation. These metrics should be tracked alongside risk measures because low valuations alone do not guarantee outperformance if downside risk is elevated.

Setting Up an Effective Portfolio Dashboard
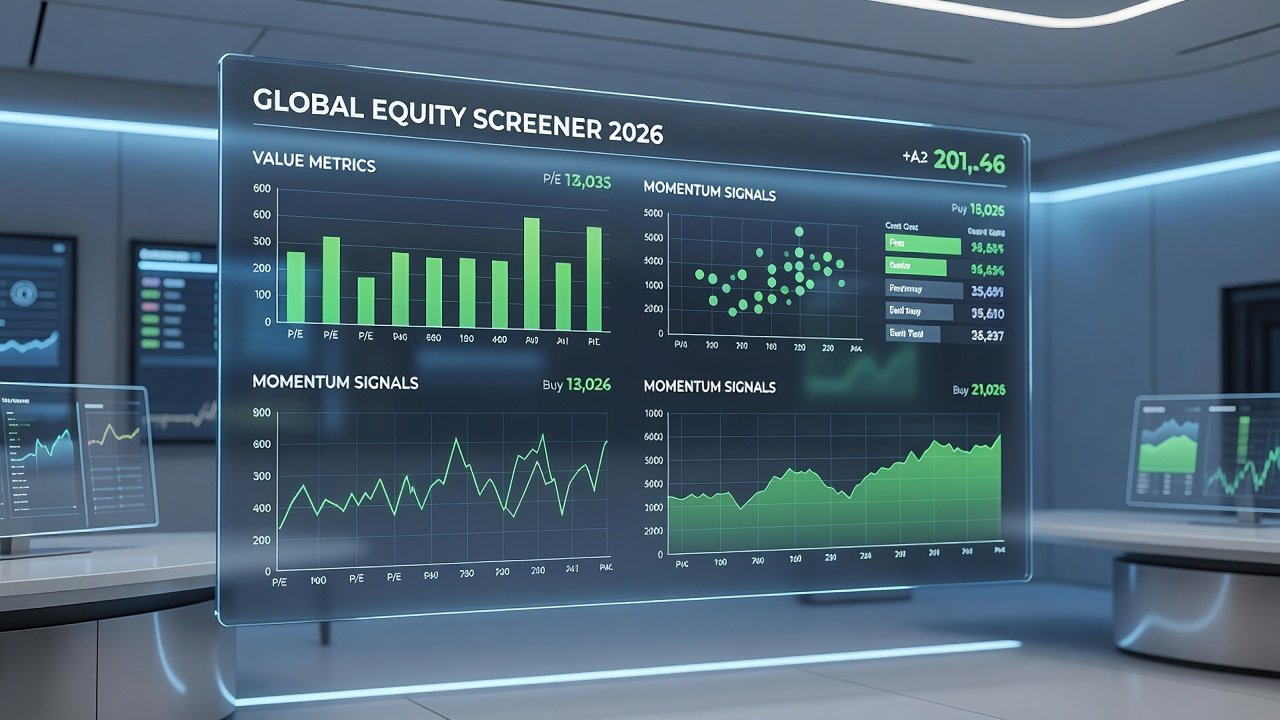
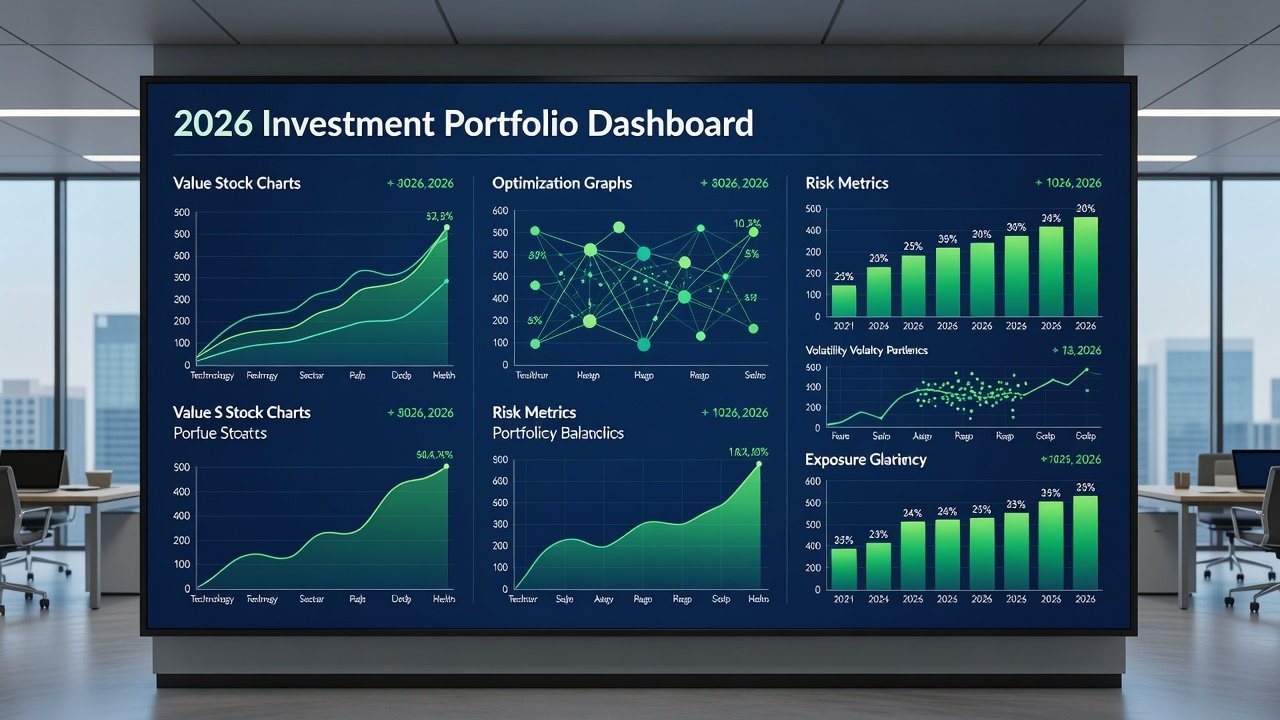
An integrated dashboard displays all five metrics on a single screen with weekly updates. Columns typically include current alpha, information ratio, downside capture, trailing and forward P/E, and free cash flow yield. Conditional formatting highlights values outside tolerance bands, such as alpha falling below zero or downside capture exceeding 95%. Connecting the dashboard to reliable data providers ensures accuracy and reduces manual errors.
Quarterly Review Checklist for Sustained Improvement
- Recompute every metric using the most recent twelve-month window and compare against the prior quarter.
- Evaluate individual positions driving the largest positive or negative contributions to alpha.
- Verify that free cash flow trends remain positive for at least 70% of holdings.
- Assess whether any new positions have increased tracking error beyond acceptable limits.
- Document planned rebalancing actions and their projected effect on future ratios.
- Review benchmark appropriateness and consider peer-group comparisons when needed.
Integrating Metrics for Holistic Decision Making
Effective managers examine metrics together rather than in isolation. A portfolio showing strong alpha but rising downside capture may require trimming high-beta holdings. Conversely, excellent free cash flow yields paired with a low information ratio suggest the need for more concentrated positions. This integrated view prevents over-reliance on any single indicator and supports balanced portfolio construction.
Case Study: Metric-Guided Portfolio Adjustments
In Q1 2026, a value portfolio exhibited an information ratio of 0.28 and downside capture of 112%. Analysis revealed three holdings with deteriorating free cash flow and elevated betas. After reducing exposure to these names and reallocating to companies with stronger cash generation and lower downside capture, the information ratio rose to 0.61 and downside capture improved to 84% by Q3. The adjustments preserved alpha while enhancing risk-adjusted consistency, illustrating how regular metric reviews translate into concrete performance gains.
Common Tracking Errors and How to Avoid Them
Investors frequently miscalculate beta by mixing daily and monthly returns or by using mismatched benchmark constituents. Another error involves reporting gross returns instead of net-of-fee performance, which inflates alpha. Survivorship bias can also distort peer comparisons when failed funds are excluded from benchmarks. To mitigate these issues, standardize calculation periods, always use net returns, and select broad, rules-based benchmarks that reflect the strategy’s investable universe.
Automation Tools and Ongoing Best Practices
Portfolio analytics platforms and spreadsheet templates connected to market data APIs can automate metric updates and generate alerts when thresholds are breached. Regular validation against official regulatory filings helps maintain data integrity. Investors can consult resources from the SEC website for filing standards and the Federal Reserve for macroeconomic context that influences benchmark returns. Additional guidance is available through the Bank for International Settlements on global risk factors affecting value strategies.
Conclusion
Mastering alpha, information ratio, downside capture, P/E, and free cash flow yield equips active value investors with the visibility required to refine decisions and sustain outperformance in 2026 markets. Consistent application of these metrics, supported by disciplined quarterly reviews and integrated dashboards, transforms raw performance data into actionable insights that protect capital and enhance returns over time.
No comments yet. Be the first!