 Bullish Portfolio

Introduction to Portfolio Optimization in Active Value Investing
Active value investing focuses on identifying undervalued assets while actively managing positions to capitalize on market inefficiencies. In 2026, blending this approach with sophisticated optimization methods helps investors navigate volatility, inflation shifts, and sector rotations. This article explores mean-variance optimization, risk parity adjustments, factor integration, and practical implementation for building resilient portfolios. Investors must understand how these tools interact with real-time valuation data and economic indicators to avoid common value traps while pursuing alpha.
Effective optimization balances expected returns against risk, incorporating valuation screens and market cycle indicators. Investors can reweight holdings dynamically to maintain value exposure without excessive drawdowns. The goal is not simply to buy cheap stocks but to construct a portfolio where each position contributes optimally to risk-adjusted performance over multiple market regimes.
Mean-Variance Optimization for Value Portfolios
Mean-variance optimization, pioneered by Harry Markowitz, forms the foundation of modern portfolio theory. For active value investors, it involves calculating expected returns from undervalued securities and minimizing portfolio variance. In practice, screen for stocks with low price-to-earnings ratios and high free cash flow yields, then apply covariance matrices to determine optimal weights. The process begins with estimating asset returns using historical data adjusted for forward earnings guidance, building a correlation matrix, and solving the quadratic optimization problem. This method shines when value stocks exhibit low correlations with growth sectors during economic recoveries.
To implement, collect at least five years of price and fundamental data for the candidate universe. Adjust expected returns upward for stocks trading at significant discounts to intrinsic value based on discounted cash flow models. Constraints such as maximum sector exposure and minimum liquidity thresholds prevent over-concentration. The output is a set of weights that maximize return for a given risk level or minimize risk for a target return. Regular recalibration is essential because correlations shift during stress periods.
Risk Parity Adjustments in Value Strategies
Risk parity allocates capital so each asset contributes equally to overall portfolio risk, rather than equal dollar amounts. For value investors, this means overweighting defensive value names like utilities or consumer staples during late-cycle phases while underweighting cyclical value plays. Adjustments involve scaling positions based on volatility forecasts. For instance, increase allocation to stable dividend payers when equity volatility spikes. This reduces concentration risk in traditional value clusters such as financials and energy.
- Identify risk contributions using marginal risk metrics
- Rebalance quarterly using updated volatility estimates
- Incorporate leverage constraints to avoid excessive borrowing
- Monitor drawdown limits tied to personal risk tolerance
Practical application often requires iterative testing. Start with equal risk budgets across value sub-sectors, then tilt based on current valuation spreads. This approach proved resilient in past downturns by preventing overexposure to beaten-down but still-volatile industries.
Factor Integration with Valuation Screens
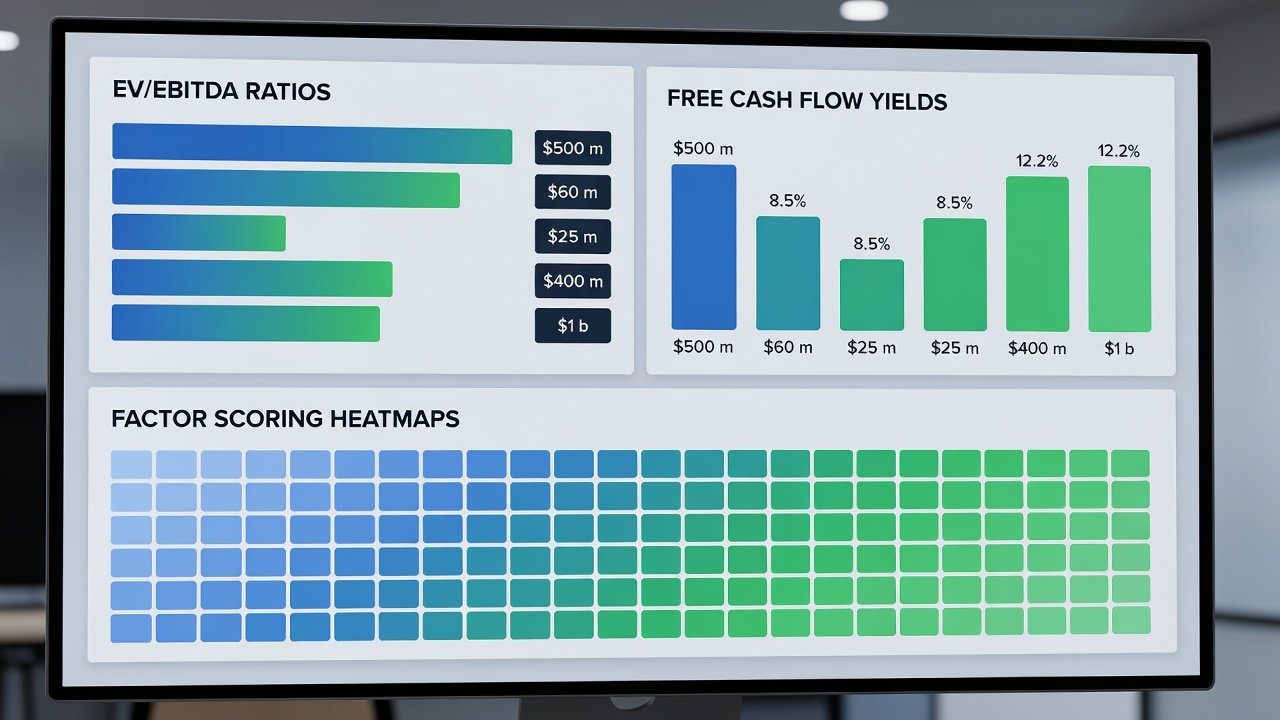
Combining value factors with momentum, quality, and low-volatility factors enhances robustness. Start with a valuation screen excluding stocks above median industry multiples, then layer additional factors to filter for improving fundamentals. Market cycle data integration uses leading indicators like yield curve spreads and PMI readings to tilt toward deep value during contractions. 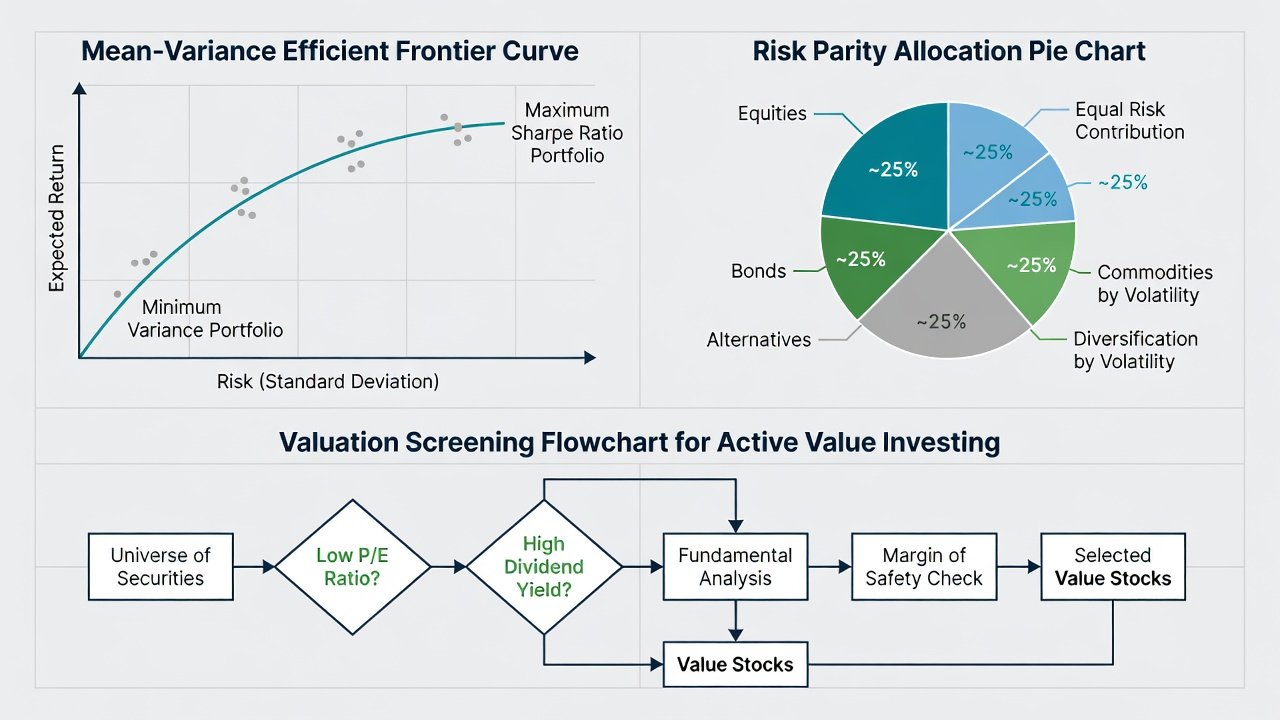
Factor integration requires careful weighting. Assign higher importance to value during early recovery phases and emphasize quality when late-cycle warning signs appear. Backtesting these combinations on historical data reveals periods where pure value underperforms blended factors, guiding live adjustments.
Practical Implementation Steps
Begin by defining the investment universe and constraints such as position limits and turnover caps. Next, gather data on valuations and cycles from reliable sources. Run optimization routines using solver software, backtest against benchmarks like the Russell 1000 Value Index, and set rebalancing rules that trigger on both calendar dates and deviation thresholds. Monitor for style drift quarterly by reviewing factor exposures. Document every assumption so the process remains repeatable and auditable.
Real-World Reweighting Examples
Consider a hypothetical portfolio heavy in undervalued energy stocks. When oil cycle data signals peak, shift 15 percent allocation toward undervalued healthcare names with strong balance sheets. This maintains value bias while adapting to cycles. Another example involves financial sector holdings during rising interest rate environments: gradually reduce weights in favor of undervalued industrial companies showing improving earnings momentum. Track the impact on overall Sharpe ratio after each reweighting to confirm the change adds value.
Comparing Optimization Software Tools
Several platforms support these techniques. Institutional-grade solutions like those from Bloomberg offer advanced solvers and integrated data feeds, while open-source options in Python using libraries such as CVXPY provide flexibility for custom models. Retail investors may prefer Portfolio Visualizer for quick scenario analysis or Excel with add-ins for simpler mean-variance runs. Choose based on data integration needs, computational scale, and the ability to incorporate custom valuation screens. Open-source tools excel for transparency but demand programming knowledge, whereas commercial platforms reduce setup time at the cost of subscription complexity.
Performance Metrics and Evaluation
Track Sharpe ratio, Sortino ratio, maximum drawdown, and information ratio. Compare optimized value portfolios against plain benchmarks like the S&P 500 value index. Consistent outperformance stems from disciplined rebalancing tied to valuation signals. Additional metrics such as Calmar ratio and upside capture help assess behavior across full market cycles. Review rolling three-year and five-year windows to ensure results are not driven by a single favorable period.
Incorporating Market Cycles and Valuation Screens
Use economic regime models to adjust optimization inputs. During expansion phases, favor growth-at-a-reasonable-price stocks; in recessions, emphasize asset-light value plays. Integrate screens from sources like SEC filings for accurate fundamental data. Combine with macroeconomic releases from Federal Reserve economic data and research from CFA Institute to refine cycle detection. This layered approach reduces the chance of optimizing for an outdated regime.
Common Mistakes to Avoid
Many investors overlook transaction costs and taxes when running optimizations, leading to overstated backtest results. Another frequent error is using stale covariance estimates that fail to capture recent volatility spikes. Overfitting to historical value premiums without forward-looking adjustments also erodes live performance. Always stress-test models under extreme scenarios such as 2008-style liquidity events or 2022 inflation shocks.
Conclusion
Portfolio optimization elevates active value investing by providing a systematic framework for 2026 markets. By mastering these methods, investors achieve better risk-adjusted returns while staying true to value principles. Continuous learning and disciplined execution remain the keys to long-term success.
FAQ: Common Pitfalls and Customization
What are common optimization pitfalls? Overfitting historical data and ignoring transaction costs often lead to poor live performance. Always validate with out-of-sample testing and include realistic cost assumptions in every simulation.
How to customize for different risk tolerances? Conservative investors increase constraints on volatility and add drawdown limits; aggressive ones allow higher factor tilts and shorter rebalancing horizons. Adjust the risk aversion parameter in mean-variance models accordingly and run sensitivity analysis on key inputs.
Should market cycle data always be included? Yes, as it prevents procyclical mistakes, but combine with robust valuation screens from authoritative sources for reliability. Test multiple cycle indicators to avoid false signals from any single metric.
What software is best for beginners? Start with user-friendly platforms that offer pre-built value factor templates before moving to custom code. This builds intuition while minimizing early errors.
No comments yet. Be the first!