 Bullish Portfolio
Introduction to Quantitative Value Investing in 2026
Active value investing has evolved significantly by 2026, blending traditional principles of buying undervalued assets with rigorous quantitative methods. Investors now rely on data-driven models to identify opportunities in volatile markets influenced by technological shifts, geopolitical tensions, and evolving monetary policies. This approach enhances decision-making by replacing subjective judgments with measurable metrics and systematic processes that can be tested and refined over time. Quantitative fundamental analysis integrates statistical models, financial ratios, and algorithmic screening to uncover stocks trading below their intrinsic value. It builds on Benjamin Graham's foundational ideas while incorporating modern tools like factor scoring and backtesting. As markets become more efficient due to high-frequency trading and algorithmic participation, this hybrid strategy provides an edge for active portfolios seeking consistent alpha generation. In 2026, successful practitioners combine deep fundamental understanding with computational power to process vast datasets quickly, allowing for real-time adjustments to portfolio holdings based on emerging signals.
Core Metrics Driving Quantitative Value Strategies
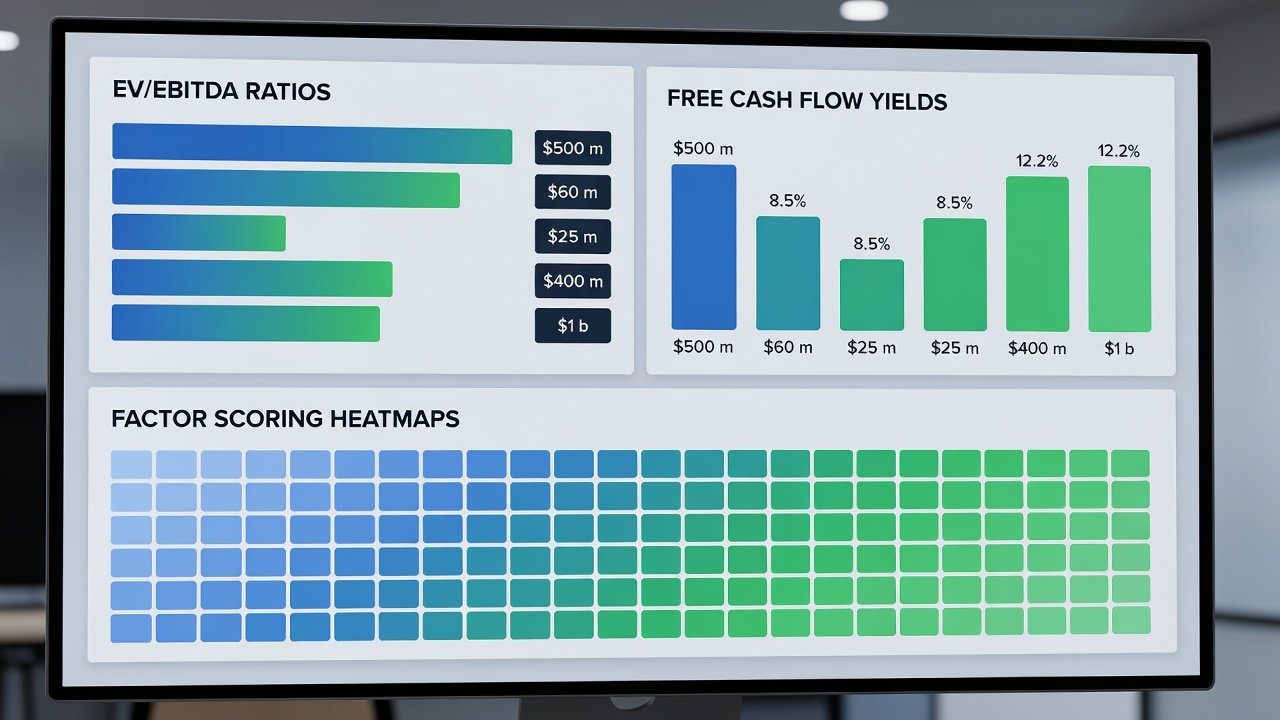
Several key financial metrics form the backbone of quantitative value analysis. Enterprise Value to EBITDA (EV/EBITDA) measures a company's operational profitability relative to its total value, helping identify undervalued firms with strong cash generation potential across different capital structures. Free cash flow yields assess how much cash a company generates after capital expenditures, signaling true economic value available to shareholders for dividends, buybacks, or reinvestment. Additional metrics often include price-to-book ratios adjusted for intangible assets and return on invested capital to gauge efficiency in deploying shareholder funds. Factor scoring systems combine multiple metrics into composite scores. For example, a basic scoring model might weight EV/EBITDA at 30%, free cash flow yield at 40%, and return on invested capital at 30%. Calculation example: For a stock with EV/EBITDA of 8.5, free cash flow yield of 6.2%, and ROIC of 12%, the weighted score could be computed as (inverse normalized 8.5 * 0.3) + (6.2 * 0.4) + (12 * 0.3), yielding a composite value for ranking against peers. These scores allow systematic comparison across thousands of securities, reducing emotional bias in selection.
Practical Calculation Walkthrough
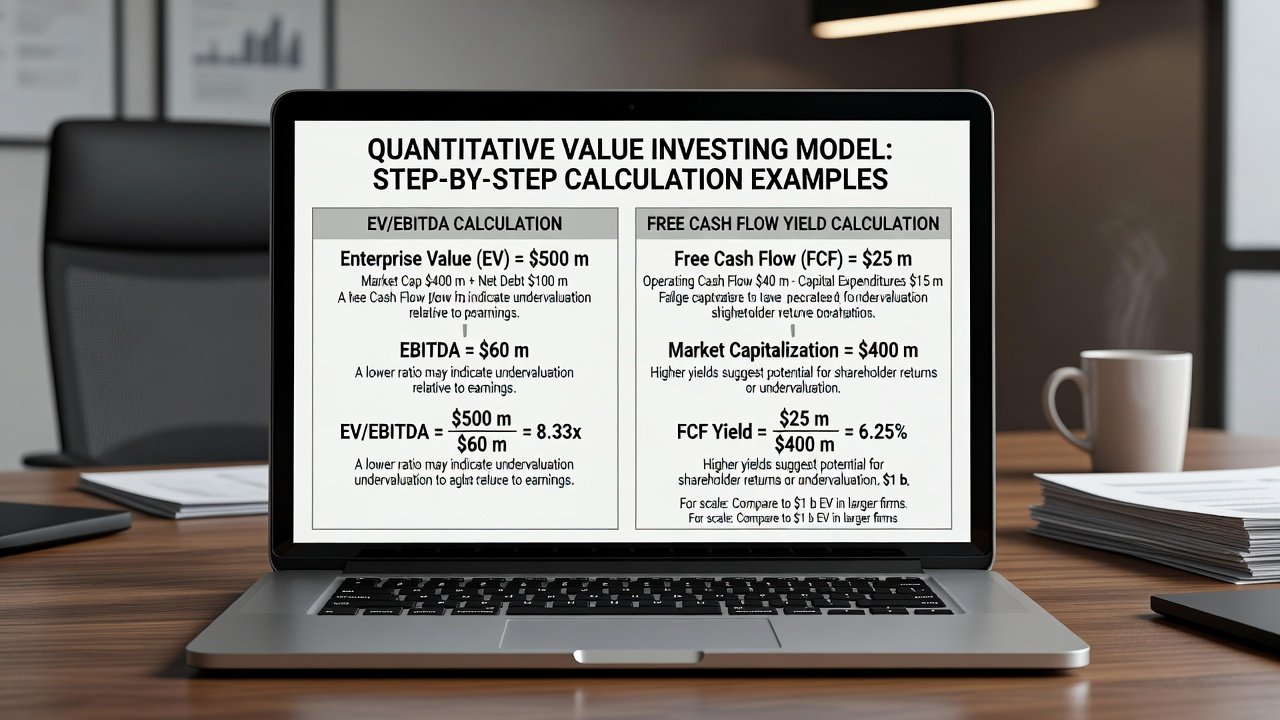
Consider a hypothetical company with $500 million enterprise value, $60 million EBITDA, $25 million free cash flow, and $400 million market cap. EV/EBITDA equals 8.33. Free cash flow yield is free cash flow divided by market cap, equaling 6.25%. These figures feed into screening filters to flag candidates below industry averages. Expanding further, analysts might layer in normalized earnings over a five-year cycle to smooth out one-time events, ensuring the metrics reflect sustainable operations rather than temporary fluctuations.
Building Effective Screening Models
Step-by-step guidance starts with defining universe criteria, such as market cap above $1 billion and average daily trading volume exceeding 500,000 shares for liquidity. Next, apply metric filters: EV/EBITDA below 10, free cash flow yield above 5%, and positive earnings growth over three years. Advanced models incorporate quality factors like low debt-to-equity ratios below 0.5 and earnings stability measured by standard deviation of returns. Implement these in spreadsheet tools or programming environments by pulling data from reliable sources and ranking results. Test for multicollinearity among factors to avoid redundant signals that could distort the overall score. Regular updates ensure the model adapts to new financial reports released quarterly. A practical example involves creating a multi-stage screen: first pass removes high-debt companies, second pass ranks remaining names by composite value score, and third pass applies sector-neutral adjustments to prevent over-concentration in cyclical industries.
Backtesting and Integrating Momentum Signals
Backtesting validates strategies by simulating historical performance across market cycles from 2000 onward, using rolling windows to account for regime changes. Divide data into training and out-of-sample periods, then measure Sharpe ratios, maximum drawdowns, and win rates. This reveals whether quantitative value signals outperform benchmarks during downturns or inflationary periods. Integrating momentum signals adds a timing layer. Combine value scores with 12-month price momentum filters to avoid value traps where cheap stocks continue declining. For instance, only buy high-value-score stocks showing positive momentum above the 50-day moving average while avoiding those with negative 6-month trends. This hybrid method balances mean-reversion with trend-following for active decisions and has shown improved risk-adjusted returns in multiple market environments.
Real-World Case Studies and Risk Adjustments
Case studies from recent years demonstrate success, such as identifying undervalued industrial firms through low EV/EBITDA and high free cash flow yields before sector recoveries in supply-chain normalization periods. Another example includes consumer staples companies flagged by factor models during 2024-2025 volatility, where quantitative screens highlighted balance sheet strength overlooked by traditional analysts. These examples highlight how quantitative lenses spotted opportunities missed by purely qualitative analysis focused on narrative rather than numbers. For 2026 economic conditions, adjust for inflation volatility and interest rate environments by incorporating macroeconomic overlays from sources like the Federal Reserve. Stress-test portfolios against recession scenarios using Monte Carlo simulations and diversify across sectors to mitigate concentration risks. Additional adjustments include monitoring central bank policy shifts and incorporating ESG-adjusted value metrics where relevant for long-term holdings.
Common Pitfalls and Implementation Checklist
Investors frequently encounter several pitfalls when applying quantitative methods. Overfitting models to past data without forward validation leads to poor out-of-sample performance. Ignoring transaction costs in backtests erodes real returns, especially in high-turnover strategies. Failing to update factor weights as market regimes shift can cause underperformance when value premiums compress. Neglecting qualitative context around quantitative signals risks holding companies with hidden liabilities such as pending litigation or regulatory changes. A comprehensive checklist for personal portfolios includes: Define clear objectives and risk tolerance before model construction. Source clean, audited data from authoritative providers. Build and backtest the model iteratively across multiple market cycles. Integrate momentum and economic filters to refine entry timing. Monitor performance quarterly using metrics like information ratio. Rebalance as needed while controlling for tax implications. Review for behavioral biases in overriding model outputs. Finally, maintain a paper trading period of at least six months before deploying real capital.
Tools, Comparisons, and Advanced Considerations
Comparing traditional value investing with quantitative approaches reveals key differences: traditional methods rely on deep company research and management interviews, while quantitative versions emphasize scalability and repeatability through code. Tools for implementation range from Excel with Power Query for beginners to Python libraries like pandas and backtrader for advanced users. Advanced considerations include regime detection algorithms that switch between value and growth tilts based on volatility indexes. Always cross-reference outputs with regulatory filings available through the U.S. Securities and Exchange Commission to confirm data accuracy.
Conclusion
Quantitative fundamentals empower active value portfolios in 2026 by providing structure and objectivity. By mastering metrics, screening, backtesting, and risk management, investors can navigate complex markets with greater confidence and discipline. Start small, refine continuously, and combine data insights with sound judgment for sustainable results. Explore additional perspectives from the Bank for International Settlements on global financial stability to inform macro adjustments in your models.


No comments yet. Be the first!