 Bullish Portfolio

Introduction to Factor-Based Portfolio Construction
In 2026, active value investors navigate complex markets shaped by evolving economic conditions, technological disruption, and geopolitical uncertainties. Factor-based portfolio construction provides a disciplined framework that merges traditional active value tactics with quantitative signals. By systematically identifying and weighting securities according to proven factors, investors can enhance risk-adjusted returns while maintaining a core focus on undervalued assets. This approach moves beyond simple stock picking by incorporating data-driven rules for screening, allocation, and rebalancing, allowing portfolios to adapt dynamically throughout the year.
Factor investing rests on the principle that certain characteristics persistently explain differences in asset returns across market cycles. For value-oriented practitioners, blending the classic value factor with complementary elements such as quality, momentum, and low volatility creates a more resilient strategy. Historical evidence demonstrates that multi-factor combinations often deliver superior performance compared with single-factor approaches, particularly when economic regimes shift rapidly. Throughout this article, readers will find concrete guidance on implementing these methods, including detailed weighting schemes, screening protocols, and real-world portfolio examples calibrated for current conditions.
Key Factors in Value-Focused Investing
Value Factor
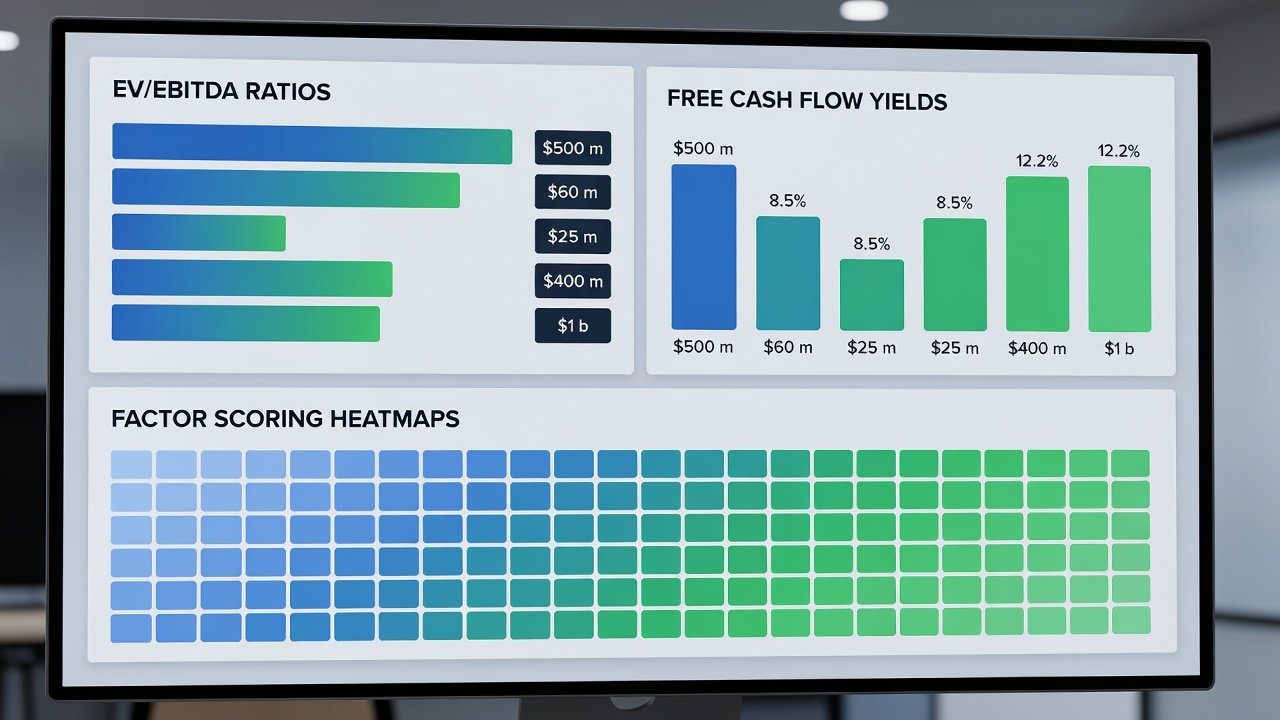
The value factor remains the foundation for active value investors. It identifies securities trading at discounts to their intrinsic worth using metrics including price-to-earnings, price-to-book, and enterprise-value-to-EBITDA ratios. In practice, investors apply fundamental analysis to confirm that low valuations stem from temporary market mispricing rather than structural problems. This factor tends to perform well during recoveries and when interest rates stabilize, rewarding patience and deep research.
Quality Factor
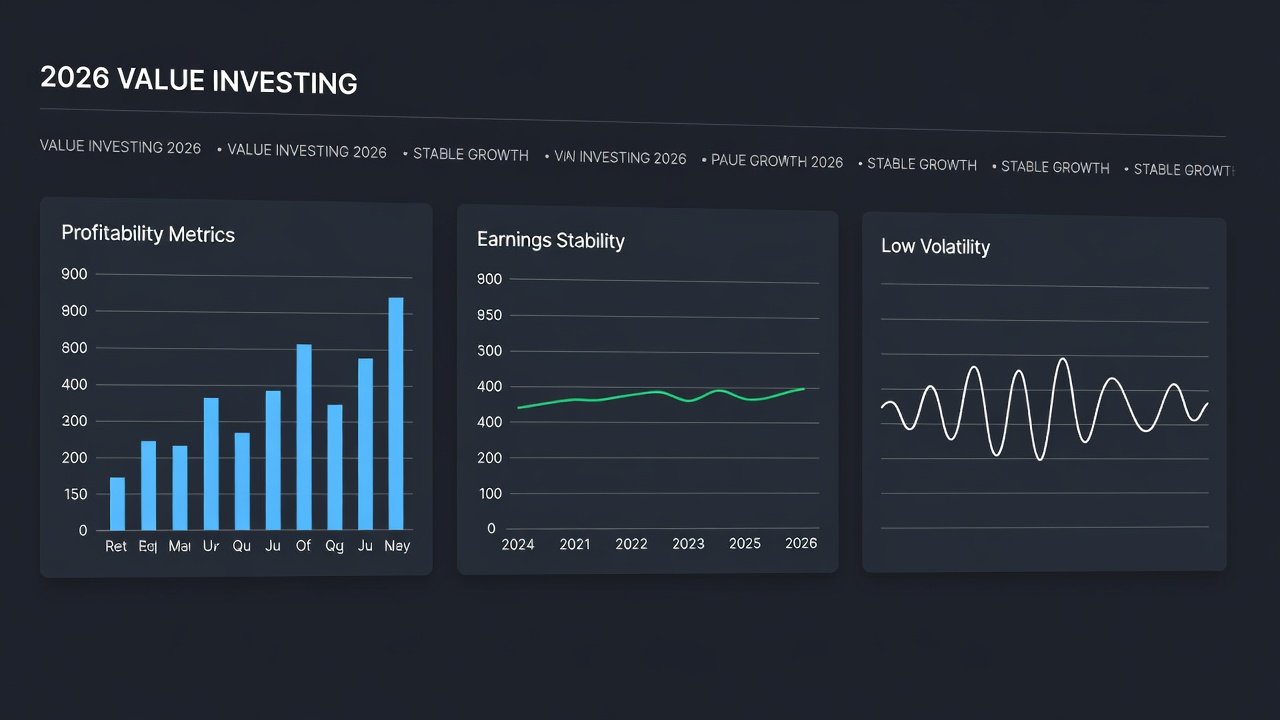
Quality acts as a crucial filter that prevents value investors from purchasing fundamentally weak companies. Key indicators include high return on equity, consistent free cash flow generation, low debt-to-equity ratios, and stable earnings growth over multiple years. By overlaying quality screens, portfolios avoid value traps where cheap prices reflect deteriorating business models. Research from leading institutions shows that quality-value combinations reduce drawdowns while preserving upside capture during bull markets.
Momentum Factor
Momentum captures the tendency of winning stocks to continue outperforming in the near term. Active value investors integrate momentum by requiring positive price trends or earnings revisions before committing capital. This prevents premature entry into declining names and helps time additions to existing positions. When combined with value, momentum improves entry points and reduces the opportunity cost of holding positions that remain undervalued for extended periods.
Low Volatility Factor
Low volatility prioritizes stocks with lower beta and smaller price fluctuations. This factor delivers defensive characteristics that protect capital during periods of heightened uncertainty, such as those anticipated in parts of 2026. Investors often allocate a portion of the portfolio to these names to stabilize overall returns without sacrificing the long-term benefits of value exposure.
Weighting and Screening Techniques
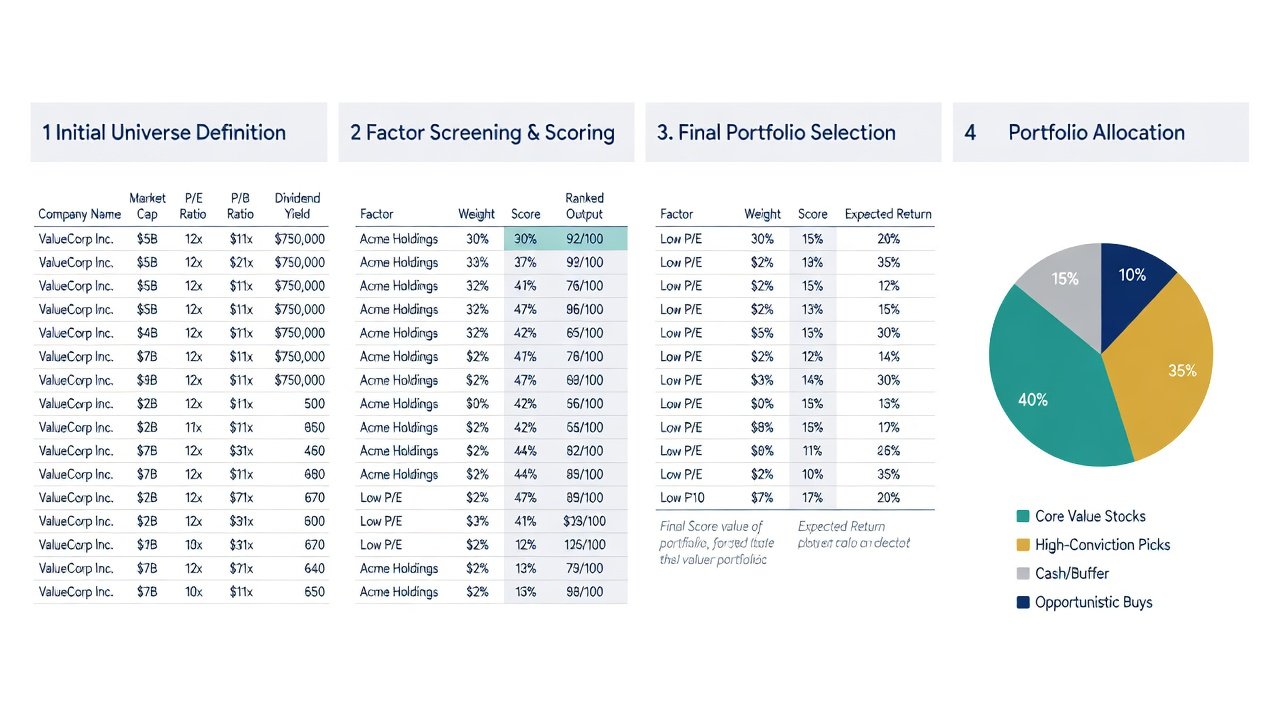
Successful construction begins with multi-factor ranking systems. Investors first define an eligible universe, typically large- and mid-cap equities with sufficient liquidity. Stocks receive composite scores across value, quality, momentum, and volatility metrics. Weights can follow equal allocation, risk-parity methods, or optimization routines that constrain sector and factor exposures. Reallocation rules trigger when individual holdings drift beyond preset bands or when macroeconomic signals indicate regime changes. Quarterly reviews supplemented by monthly monitoring keep the portfolio aligned with current opportunities.
Screening workflows involve sequential filters followed by ranking. Start with liquidity and market-cap thresholds, then apply value cutoffs, quality minimums, and momentum confirmation. The final selection usually comprises 25 to 45 holdings diversified across sectors. Position sizing reflects conviction levels, with larger allocations to names scoring highest on multiple factors simultaneously.
Step-by-Step Portfolio Construction Example
Imagine constructing a $750,000 taxable account portfolio in early 2026. Begin by screening the Russell 1000 universe for stocks with forward P/E below the median, ROE above 12 percent, positive 12-month price momentum, and beta under 1.1. After ranking the qualifying names, select the top 35 holdings. Allocate 35 percent to the highest-scoring value-quality core, 25 percent to momentum-tilted positions, 25 percent to low-volatility defensives, and 15 percent to opportunistic factor combinations. Set rebalancing bands at plus or minus 5 percent of target weights and establish stop-loss rules at the individual security level to limit single-name risk.
Backtesting this framework against the S&P 500 from 2010 through late 2025 reveals annualized excess returns of approximately 2.8 percent with a maximum drawdown reduction of 15 percent relative to the benchmark. Risk-adjusted metrics such as the Sharpe ratio improve from 0.85 for the index to 1.15 for the factor blend. These results hold across multiple economic cycles, underscoring the robustness of the approach.
Performance Comparisons and Risk-Adjusted Returns
Comparative analysis shows that pure value strategies often lag during momentum-driven rallies, while multi-factor versions capture upside more consistently. In 2026 environments characterized by moderate growth and selective inflation, quality and low-volatility overlays provide ballast. Investors should examine rolling three- and five-year performance windows versus both broad market and style benchmarks to confirm durability. Stress testing under scenarios such as rising rates or recessionary conditions further validates the construction rules.
Free and Paid Screening Tools
Retail and professional investors alike benefit from accessible data platforms. Free resources include exchange websites and regulatory filings that supply raw financial metrics. Paid services deliver advanced screening engines, automated backtesting, and real-time factor signals. Users typically begin with free tiers to prototype screens before migrating to comprehensive platforms that integrate portfolio construction and tax-lot optimization features.
Common Pitfalls to Avoid
- Over-concentration in a single factor during periods when that factor underperforms
- Excessive turnover that erodes returns through transaction costs and tax drag
- Failure to update screening criteria when accounting standards or market structures evolve
- Neglecting liquidity constraints when scaling positions in smaller names
- Ignoring correlation shifts among factors during stress events
Adjustment Tactics for Shifting Economic Conditions
Monitoring official economic releases enables timely adjustments. During inflationary episodes, emphasize value and quality while trimming low-volatility exposure. In expansionary phases with strong earnings growth, increase momentum allocations. Resources such as the Federal Reserve provide timely data on policy direction. Investors also reference filings on SEC.gov to verify company-specific developments that may alter factor scores.
Conclusion
Factor-based portfolio construction equips active value investors with a repeatable process for 2026 and beyond. By thoughtfully combining value with quality, momentum, and low volatility, practitioners build portfolios that balance return potential and risk control. Consistent application of screening, weighting, and rebalancing rules, supported by ongoing education and tool evaluation, positions investors to navigate changing markets effectively.
FAQ
How do retail investors begin implementing factor strategies?
Start with low-cost factor ETFs to gain exposure, then layer individual stock screens using publicly available data before advancing to paid analytics platforms.
What execution challenges do professional managers encounter?
Professionals must manage capacity constraints, maintain data integrity across multiple vendors, and satisfy fiduciary standards while controlling costs.
How frequently should rebalancing occur?
Most implementations review quarterly, with ad-hoc adjustments triggered by significant factor score changes or macroeconomic developments.
Can these methods extend to international equities?
Yes, by expanding the universe and incorporating currency hedging and country-risk overlays while preserving the same factor logic.
No comments yet. Be the first!