 Bullish Portfolio
Introduction to Quality Factors in Value Investing
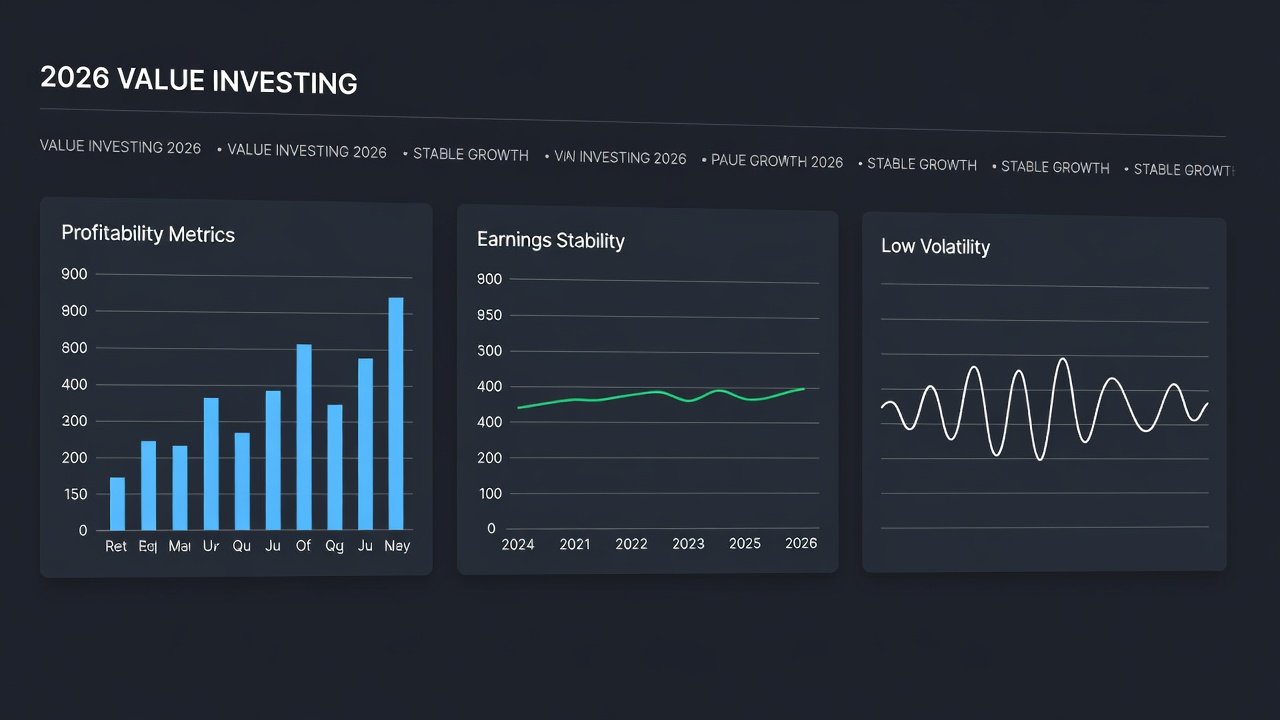
Active value investors in 2026 face increasingly complex markets where traditional price-to-earnings or book-value screens alone often fall short. Quality factors such as profitability, low volatility, and earnings stability provide a powerful overlay that filters out value traps and improves long-term outcomes. These metrics help investors identify companies with durable competitive advantages that trade at reasonable prices while maintaining operational resilience amid economic uncertainty and sector rotations.
By blending quality screens with classic value metrics, portfolios can achieve better risk-adjusted returns while avoiding firms that appear cheap for fundamental reasons. This approach has gained traction as market volatility persists and earnings quality becomes harder to assess amid economic shifts. Investors who master these combined factors often experience smoother equity curves and reduced emotional decision-making during turbulent periods.
Key Quality Factors Explained
Profitability Metrics
Profitability serves as a core quality signal. Metrics like return on equity, return on assets, and gross profit margins reveal how efficiently a company generates earnings from its resources. High and consistent profitability often indicates strong management and pricing power. For example, companies maintaining return on equity above 15 percent across multiple years demonstrate superior capital allocation compared to peers with erratic results.
Low Volatility Characteristics
Low-volatility stocks tend to deliver superior risk-adjusted performance over time. Investors screen for companies with stable share prices and lower beta relative to benchmarks. This factor reduces drawdowns during market stress while preserving upside participation. In practice, stocks with beta below 0.8 have historically shown resilience during broad market corrections without sacrificing long-term compounding potential.
Earnings Stability
Earnings stability measures the consistency of reported profits across economic cycles. Firms with low earnings variability and minimal one-time adjustments demonstrate operational resilience. This quality dimension helps active value investors sidestep companies whose apparent cheapness stems from temporary or unsustainable results, such as those reliant on aggressive accounting or one-off asset sales.
Enhancing Active Value Strategies with Quality
Pure value approaches can overweight distressed businesses. Integrating quality factors creates a more robust framework that favors undervalued companies with solid fundamentals. In 2026 markets, this combination has shown particular strength in sectors like consumer staples and industrials where earnings visibility matters. Quality overlays also improve behavioral discipline by reducing the temptation to chase the cheapest names without regard for underlying health, leading to more disciplined holding periods.
Portfolio Construction Steps Using Factor Screens
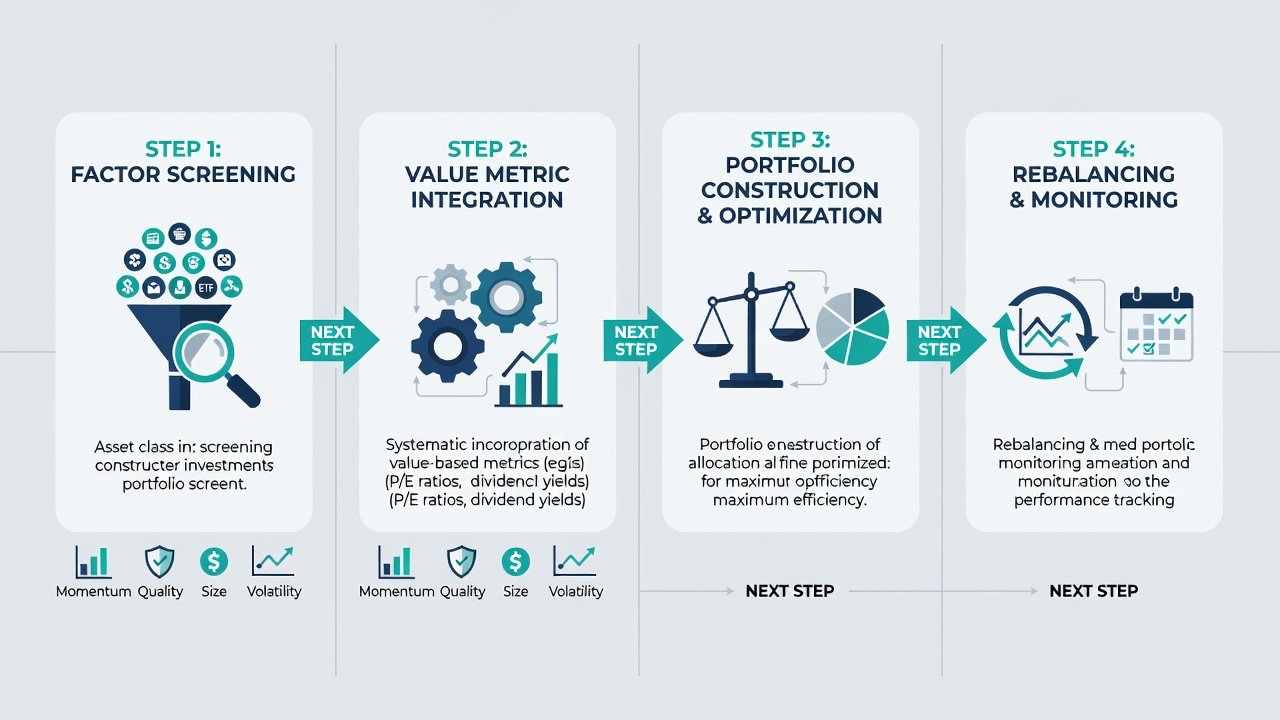
Building a quality-enhanced value portfolio follows a structured process that combines quantitative filters with qualitative judgment:
- Start with a broad universe of stocks and apply traditional value screens such as low price-to-book or price-to-earnings ratios below the market median.
- Layer quality filters: require above-median return on equity, earnings stability scores above a threshold, and beta below 1.0 to exclude high-risk names.
- Rank candidates by a composite score that weights value and quality equally, then narrow to the top quartile.
- Apply sector-neutral constraints to avoid unintended bets and ensure diversification across industries.
- Size positions according to conviction levels while maintaining diversification across 30–50 holdings, with periodic reviews for concentration risk.
- Conduct final fundamental review of balance sheet strength and competitive positioning before final allocation.
Integration with Traditional Value Metrics
Successful integration requires balancing the two approaches. Investors can use a sequential screen first eliminating low-quality names then ranking survivors by value metrics. Alternatively, a blended scoring model assigns points for each factor and selects the top decile. Both methods have merit depending on investor time horizon and rebalancing frequency. In 2026, many active managers favor the blended approach for its flexibility in adapting to changing market regimes.
Performance Comparisons and Real-World Examples
Historical backtests demonstrate that quality-value portfolios have outperformed pure value benchmarks by 2–4 percentage points annually on a risk-adjusted basis in recent decades. For instance, a hypothetical 2025–2026 portfolio combining low price-to-book with high return-on-equity delivered lower maximum drawdowns than a pure value strategy during sector rotations. Real-world implementations by large active managers show similar patterns, with quality screens helping avoid value traps in energy and financials. One illustrative case involved a mid-cap industrial firm that screened cheap on traditional metrics but was excluded due to high earnings volatility, sparing investors significant losses when its margins collapsed.
Risk-Adjusted Returns and Rebalancing Triggers
Monitoring Sharpe ratios and Sortino ratios helps quantify the benefit of quality integration. Portfolios should rebalance when quality scores deteriorate materially or when valuation gaps close beyond preset thresholds. Common triggers include quarterly earnings releases that reveal rising earnings variability or sudden increases in leverage. Investors may also set calendar-based reviews every quarter combined with event-driven adjustments to maintain optimal factor exposure without excessive turnover.
Common Pitfalls to Avoid
- Overweighting quality at the expense of value, resulting in expensive defensive stocks that underperform in strong value rallies.
- Ignoring transaction costs during frequent rebalancing, which can erode the very alpha the strategy seeks to capture.
- Failing to account for sector biases that can distort factor exposure and lead to unintended concentration.
- Using outdated data sources that lag current financial reporting standards, causing misidentification of true quality names.
- Neglecting liquidity considerations when applying screens to smaller-cap universes, potentially resulting in hard-to-trade positions.
FAQ
How should beginner investors implement quality-value strategies?
Beginners can start with broad ETFs that incorporate quality and value tilts, then gradually add individual stock screens using publicly available financial data platforms. Starting small with paper trading or model portfolios allows practice without real capital risk.
What tools support factor analysis for active investors?
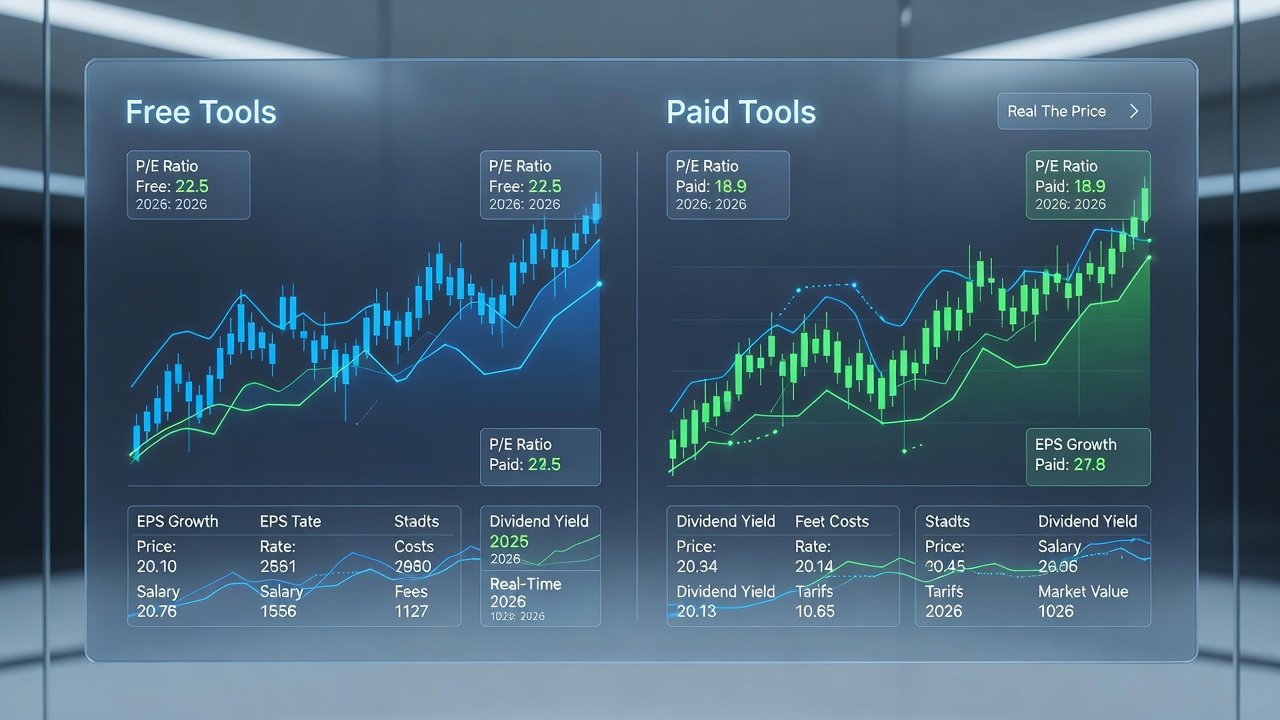
Professional platforms offer multi-factor screening, while free resources from regulatory bodies provide raw company filings for manual analysis. Authoritative sources include SEC filings, Federal Reserve economic data, and World Bank economic indicators for macro context.
Do quality factors work equally across market cycles?
Quality tends to provide downside protection in downturns and steady compounding in expansions, though outperformance versus pure value varies by regime. In bull markets driven by momentum, pure value may temporarily lead, requiring patience from quality-focused investors.
What are the tax implications of frequent rebalancing in these strategies?
Active rebalancing can generate short-term capital gains in taxable accounts. Investors should consider tax-loss harvesting opportunities and favor longer holding periods where possible to optimize after-tax returns.
Conclusion
Mastering quality factors alongside traditional value metrics equips active investors for 2026 and beyond. By following disciplined construction steps, monitoring risk-adjusted metrics, and avoiding common pitfalls, portfolios can achieve more consistent results with reduced volatility and improved long-term compounding.

No comments yet. Be the first!